Home /
Expert Answers /
Statistics and Probability /
question-1-4-1-1-use-the-following-data-to-construct-a-stem-and-leaf-plot-56-62-67-73-73-73-74-7-pa250
(Solved): Question 1 [4] 1.1. Use the following data to construct a stem-and-leaf plot: 56,62,67,73,73,73,74,7 ...
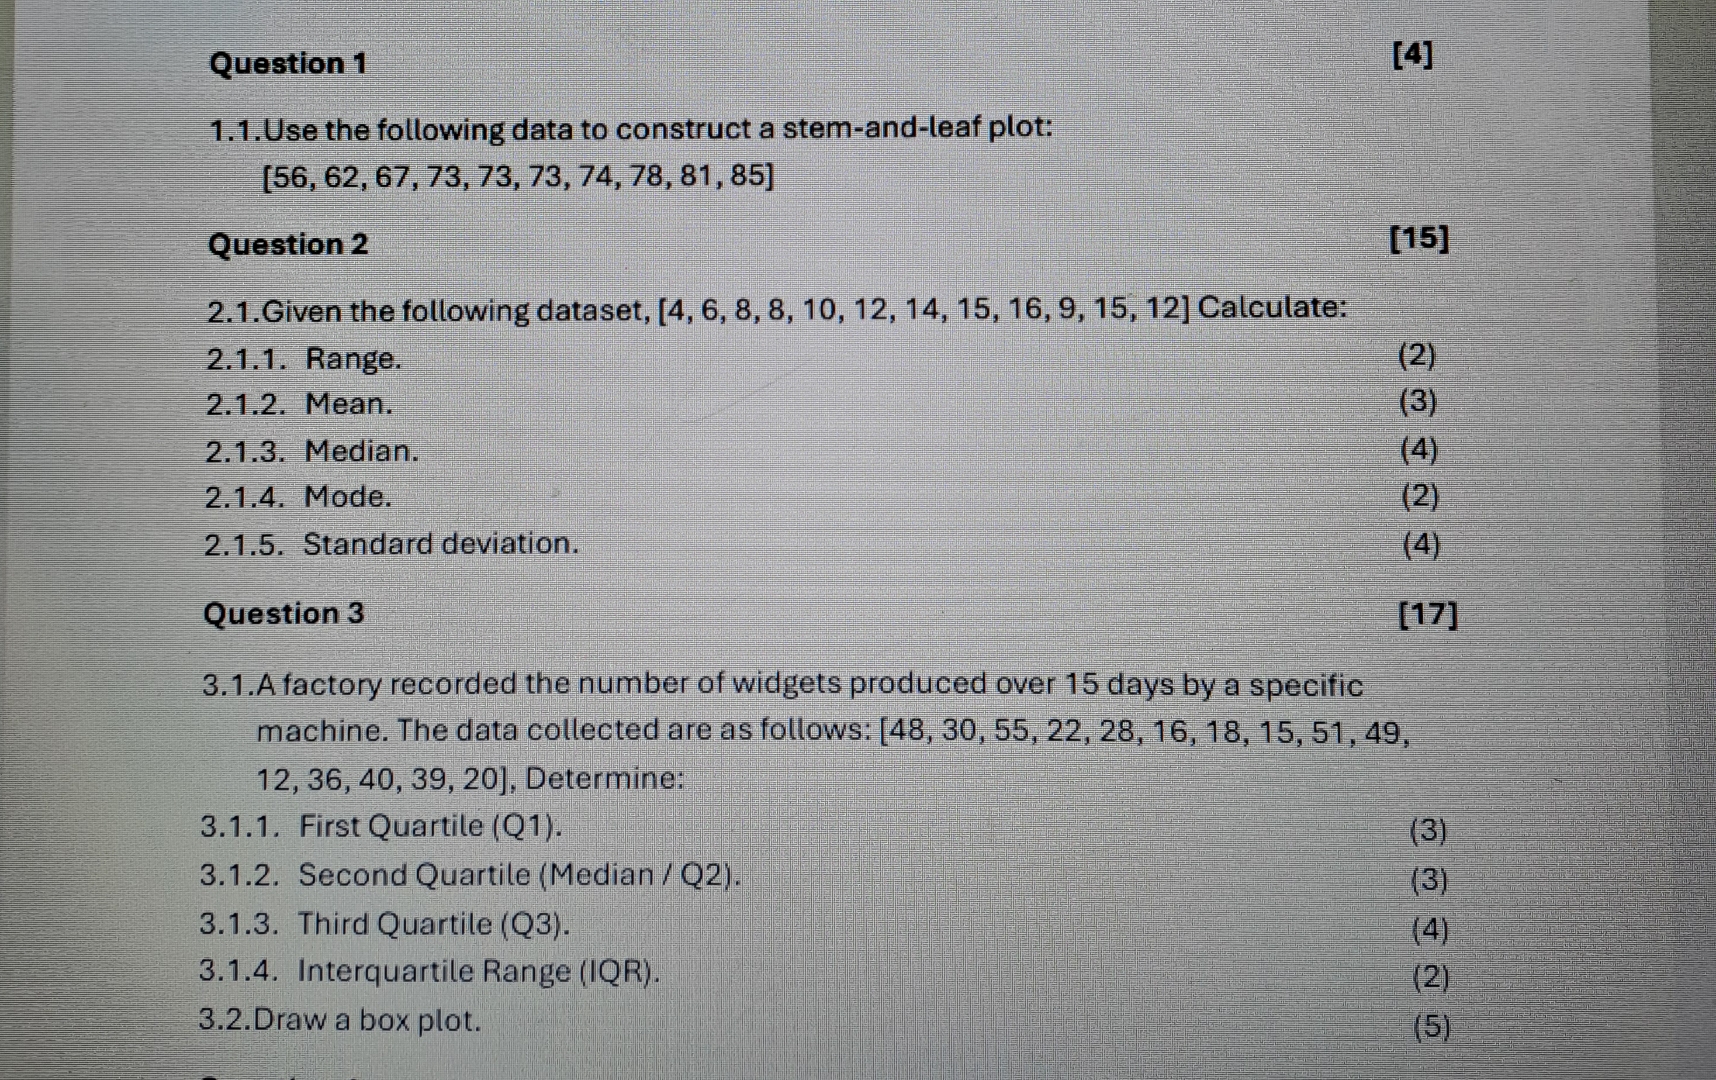
Question 1 [4] 1.1. Use the following data to construct a stem-and-leaf plot:
56,62,67,73,73,73,74,78,81,85Question 2 [15] 2.1. Given the following dataset,
4,6,8,8,10,12,14,15,16,9,15,12Calculate: 2.1.1. Range. (2) 2.1.2. Mean. (3) 2.1.3. Median. (4) 2.1.4. Mode. (2) 2.1.5. Standard deviation. (4) Question 3 [17] 3.1. A factory recorded the number of widgets produced over 15 days by a specific machine. The data collected are as follows: , 12, 36, 40, 39, 20], Determine: 3.1.1. First Quartile (Q1). (3) 3.1.2. Second Quartile (Median / Q2). (3) 3.1.3. Third Quartile (Q3). (4) 3.1.4. Interquartile Range (IQR). (2) 3.2. Draw a box plot. (5)