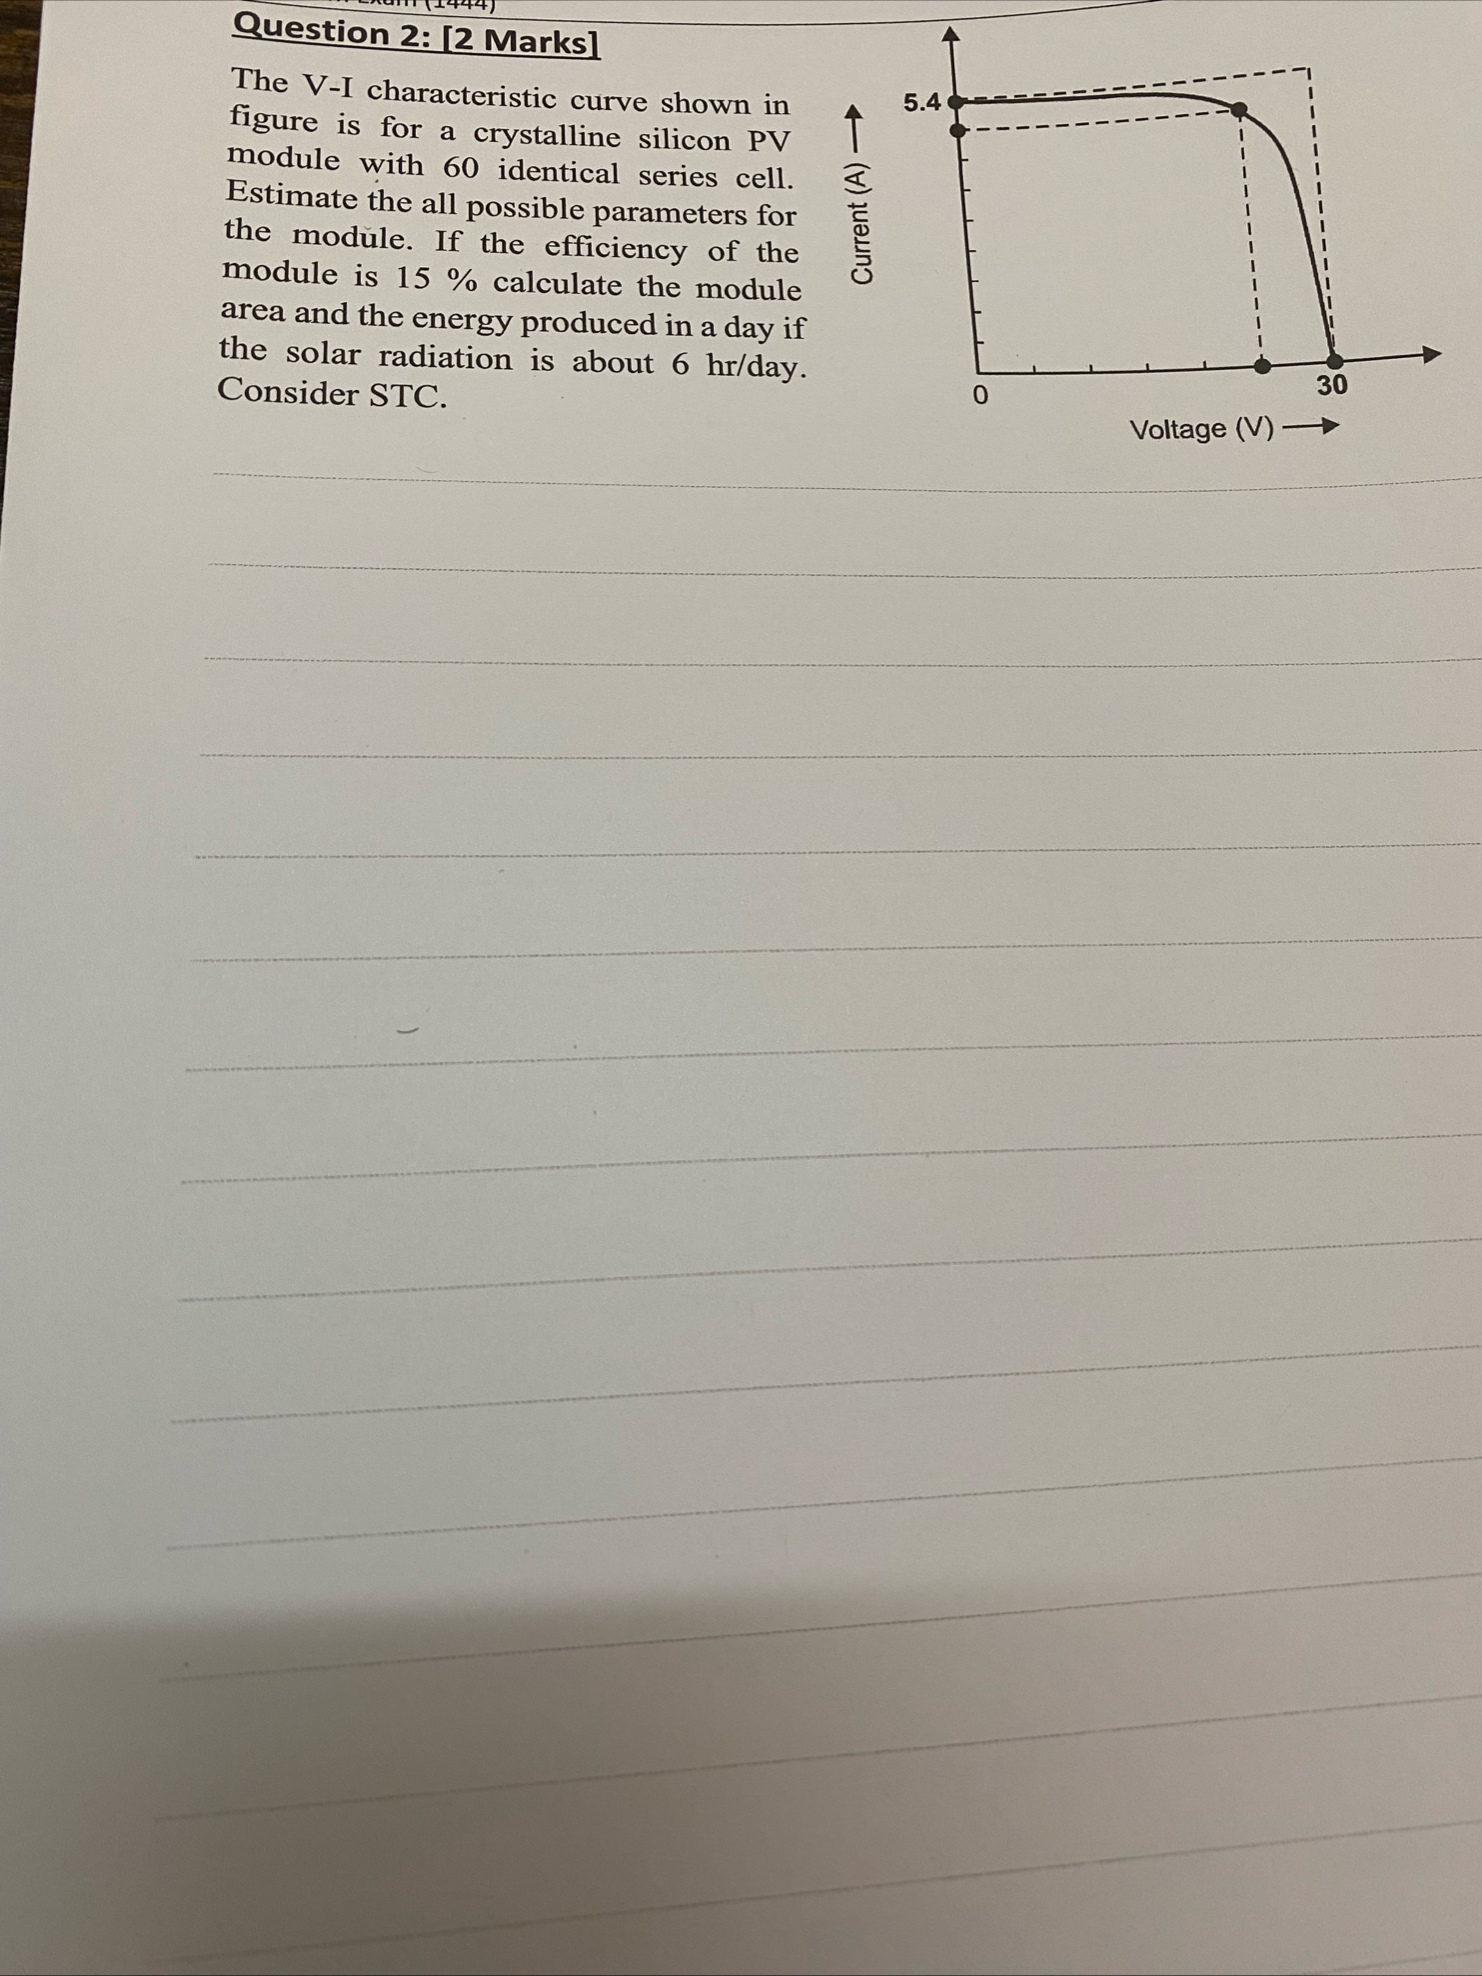
(Solved): Question 2: [2 Marks] The V-I characteristic curve shown in figure is for a crystalline silicon PV m ...
Question 2: [2 Marks] The V-I characteristic curve shown in figure is for a crystalline silicon PV module with 60 identical series cell. Estimate the all possible parameters for the module. If the efficiency of the module is
15%calculate the module area and the energy produced in a day if the solar radiation is about
6h(r)/()day . Consider STC.
q,
q,
q,
q,
q,
q,
q,
q,
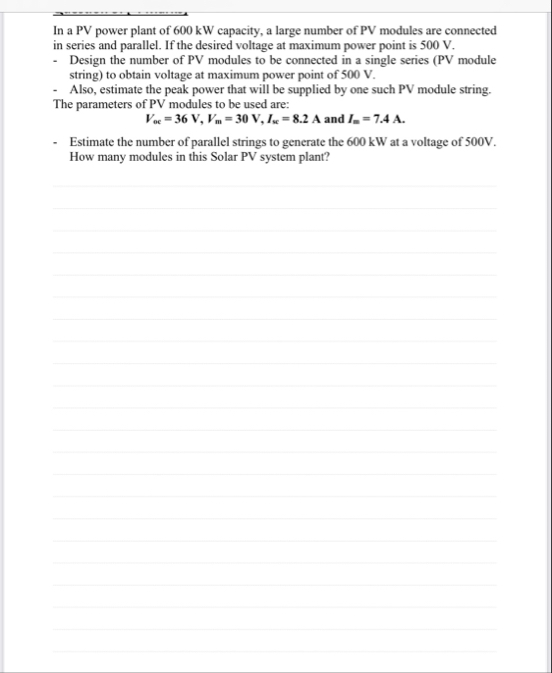
q,In a PV power plant of 600 kW capacity, a large number of PV modules are connected in series and parallel. If the desired voltage at maximum power point is 500 V . Design the number of PV modules to be connected in a single series (PV module string) to obtain voltage at maximum power point of 500 V . Also, estimate the peak power that will be supplied by one such PV module string. The parameters of PV modules to be used are:
V_(oc)=36V,V_(m)=30V,I_(sc)=8.2A and I_(m)=7.4AEstimate the number of parallel strings to generate the 600 kW at a voltage of 500 V . How many modules in this Solar PV system plant?