Home /
Expert Answers /
Economics /
question-20-nocint-aniwered-points-out-of-1-p-flasquestice-the-seasonally-adjusted-data-below-depic-pa510
(Solved): Question 20 Nocint aniwered Points out of 1 P Flasquestice The seasonally adjusted data below depic ...
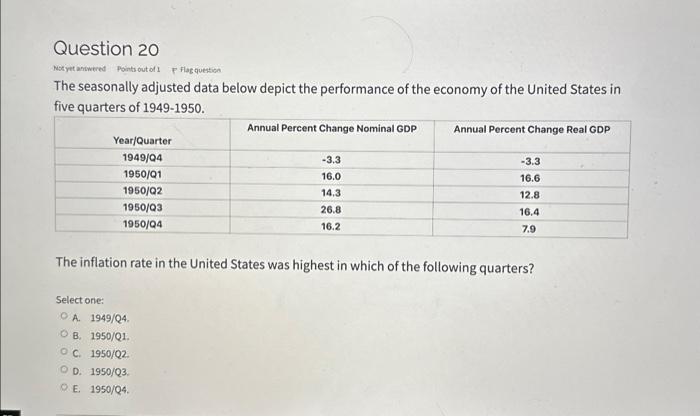
Question 20 Nocint aniwered Points out of 1 P Flasquestice The seasonally adjusted data below depict the performance of the economy of the United States in five quarters of 1949-1950. The inflation rate in the United States was highest in which of the following quarters? Select one: A. . B. 1950/Q1. C. D. . E. .