Home /
Expert Answers /
Statistics and Probability /
question-4-20-4-1-the-following-table-shows-the-monthly-household-electricity-usage-in-kwh-for-pa746
(Solved): Question 4 [20] 4.1. The following table shows the monthly household electricity usage (in kWh) for ...
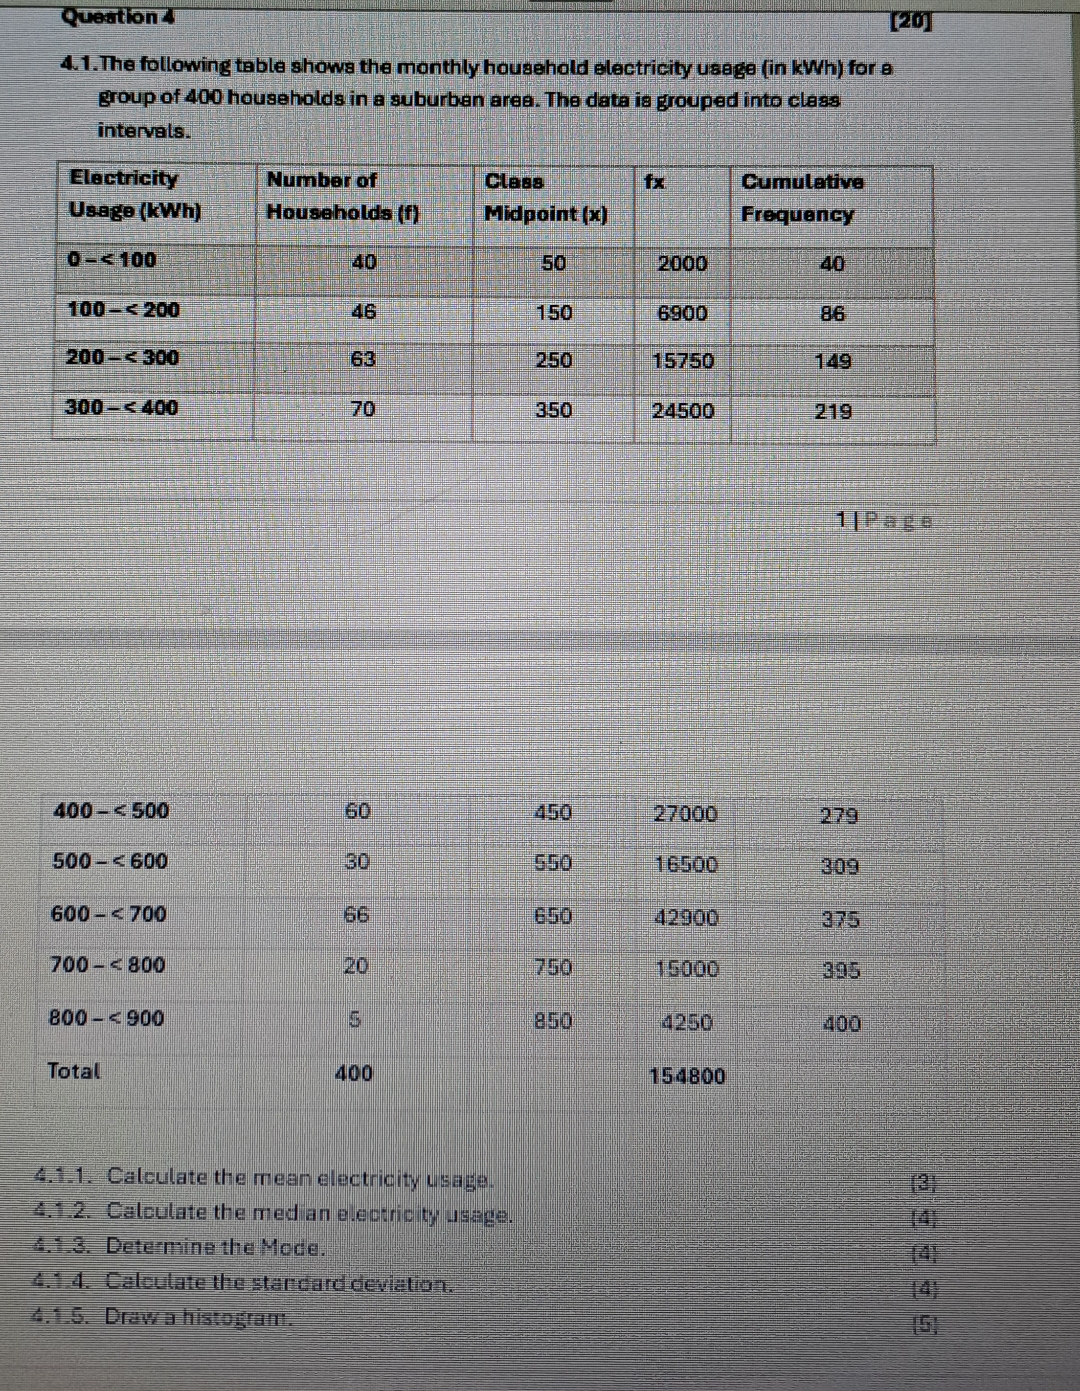
Question 4 [20] 4.1. The following table shows the monthly household electricity usage (in kWh) for a group of 400 households in a suburban area. The data is grouped into class intervals. \table[[Elactricity Usagg (kWh),Number of Households (f),Class Midpoint ( x ),fx,Cumulative Frequency],[
0-<100,40,50,2000,40],[100-<200,46,150,6900,86],[200-<300,63,250,15750,149],[300-<400,70,350,24500,219]] 1 |Page \table[[
400-<500,60,450,27000,279],[
500-<600,30,550,16500,309],[
600-<700,66,650,42900,375],[
700-<800,20,750,15000,395],[
800-<900,5,850,4250,400],[Total,400,,154800,]] 4.1.1. Calculate the mean electricity usage. (3) 4.1.2. Calculate the median electricity usage. (4) 6.1.3. Determine the Mode. (4) 4.1.4. Calculate the standard deviation. (4): 4.1.5. Draw a histogram: (5)