(Solved): Real-Time Data Analysis Exercise* Federal Government Budget in fourth quarter of 2024 \begin{tabular ...
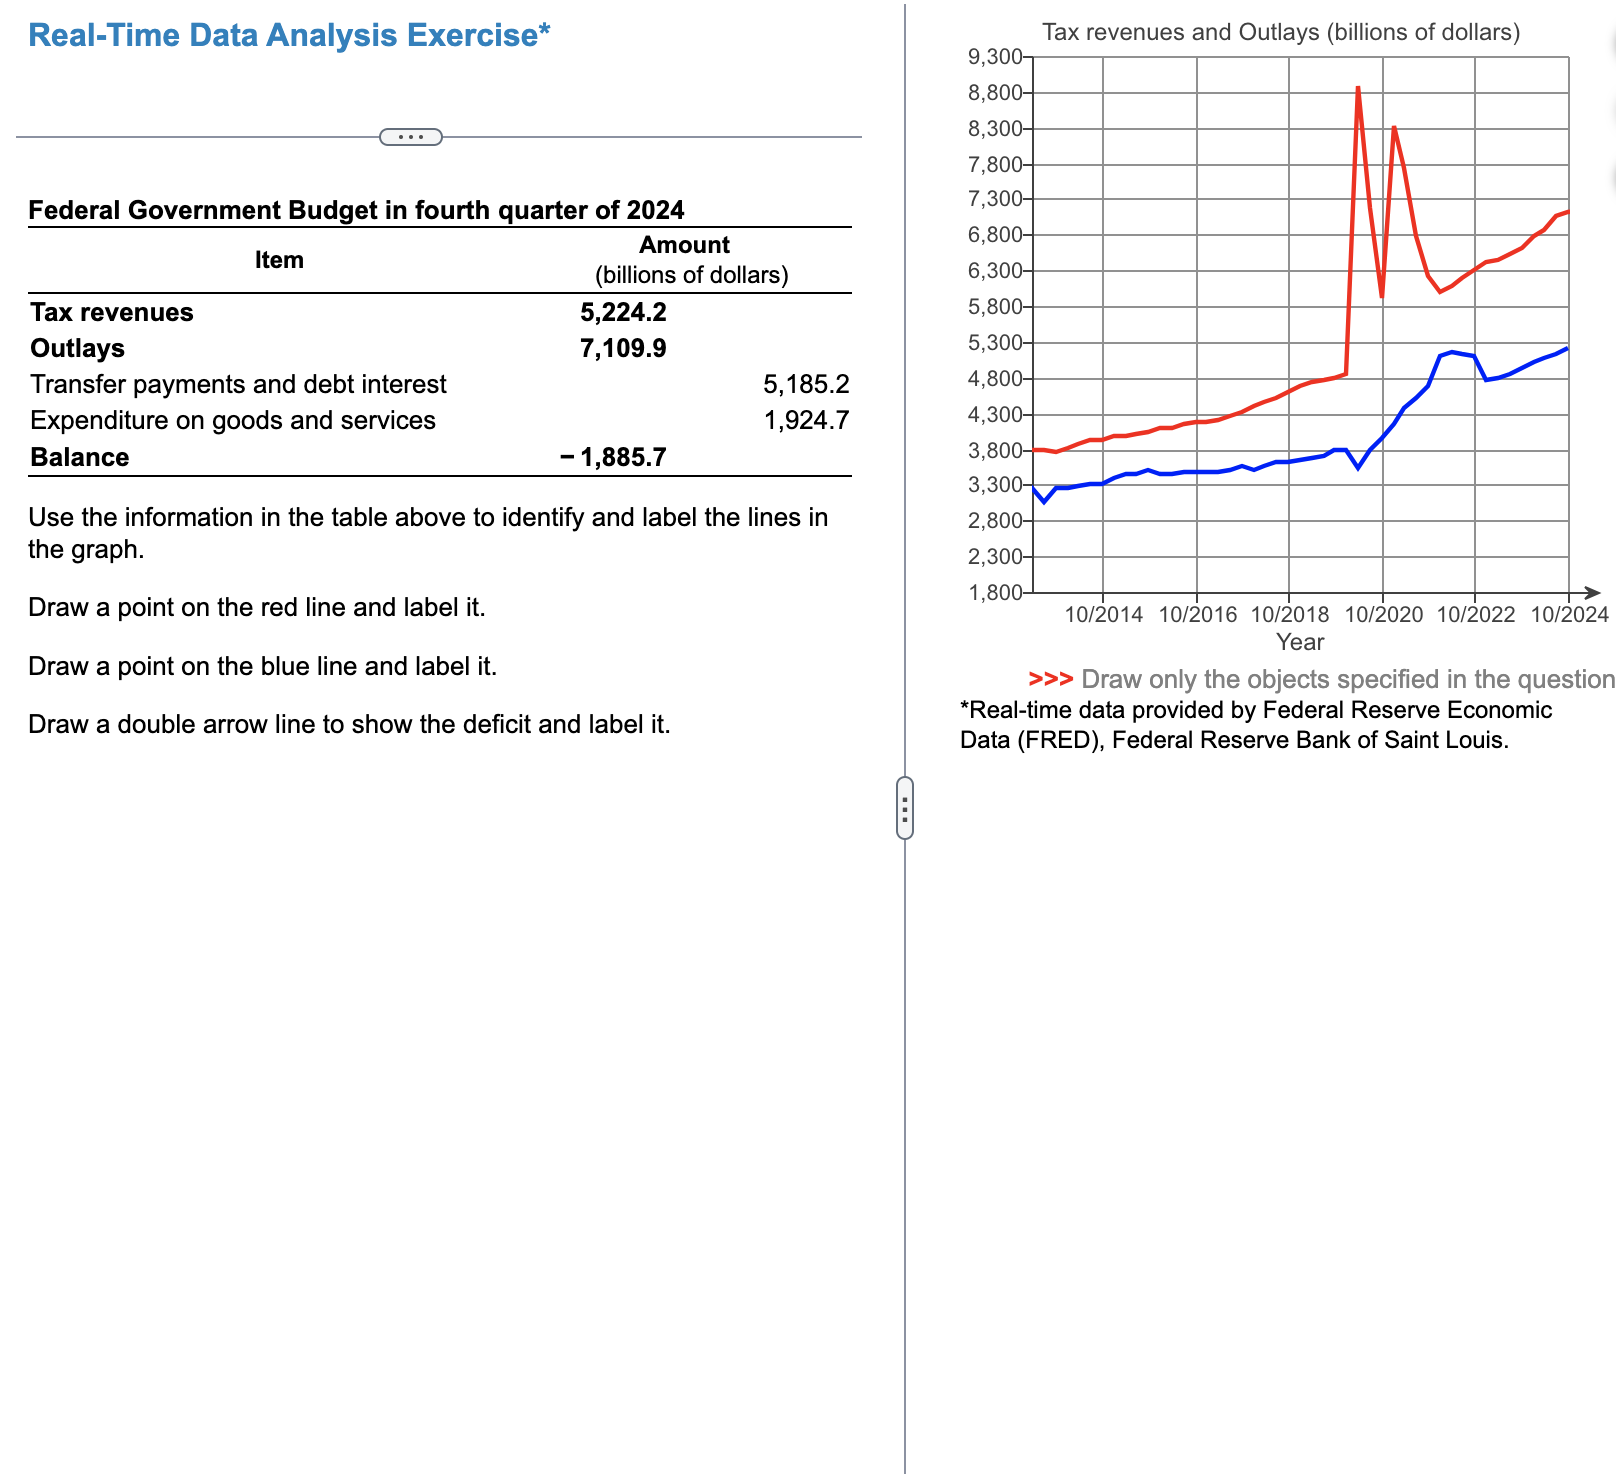
Real-Time Data Analysis Exercise* Federal Government Budget in fourth quarter of 2024 \begin{tabular}{|l|l|l|} \hline Item & Amount (billions of dollars) & \\ \hline Tax revenues & 5,224.2 & \\ \hline Outlays & 7,109.9 & \\ \hline Transfer payments and debt interest & & 5,185.2 \\ \hline Expenditure on goods and services & & 1,924.7 \\ \hline Balance & -1,885.7 & \\ \hline \end{tabular} Use the information in the table above to identify and label the lines in the graph. Draw a point on the red line and label it. Draw a point on the blue line and label it. Draw a double arrow line to show the deficit and label it. >>> Draw only the objects specified in the question *Real-time data provided by Federal Reserve Economic Data (FRED), Federal Reserve Bank of Saint Louis.