Home /
Expert Answers /
Operations Management /
refer-to-table-s6-1-factors-for-computing-control-chart-limits-3-sigma-for-this-problem-a-pro-pa592
(Solved): Refer to Table S6.1 - Factors for Computing Control Chart Limits (3 sigma) for this problem. A pro ...
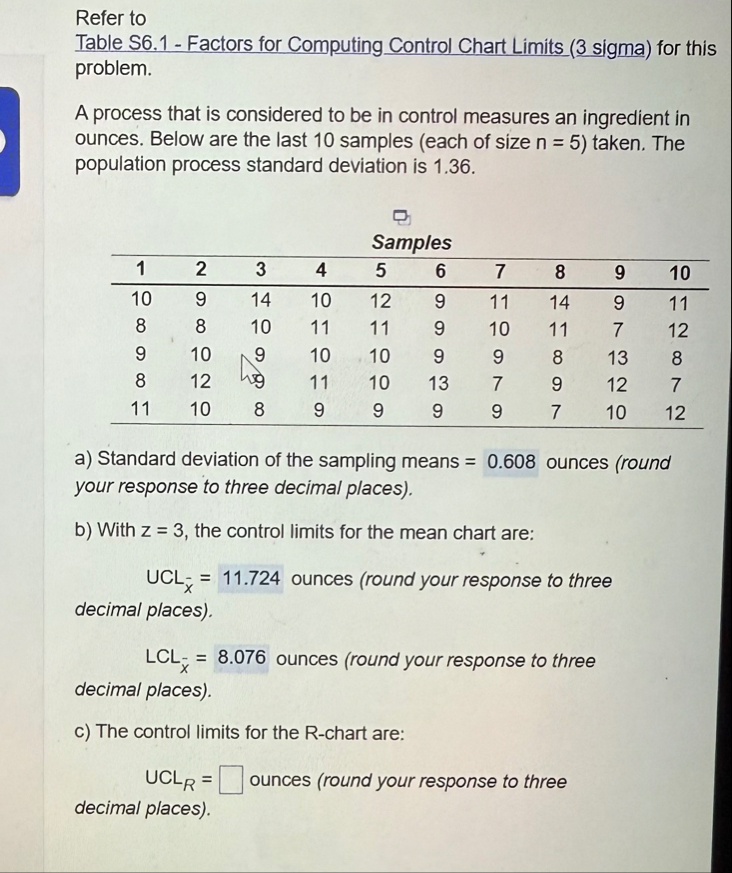
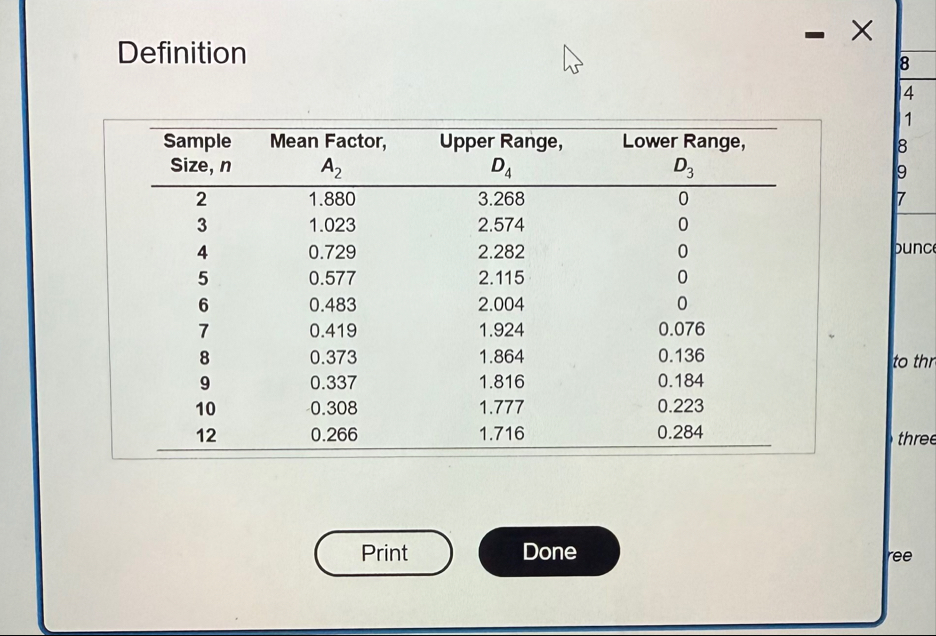
Refer to Table S6.1 - Factors for Computing Control Chart Limits (3 sigma) for this problem. A process that is considered to be in control measures an ingredient in ounces. Below are the last 10 samples (each of size
n=5) taken. The population process standard deviation is 1.36 . Samples \table[[
1,
2,
3,
4,
5,
6,
7,
8,
9,
10