Home /
Expert Answers /
Chemistry /
report-table-bx-3-data-and-calculations-table-view-list-view-data-and-calculations-for-each-titrat-pa282
(Solved): Report Table BX.3. Data and Calculations Table view List view Data and Calculations for each titrat ...
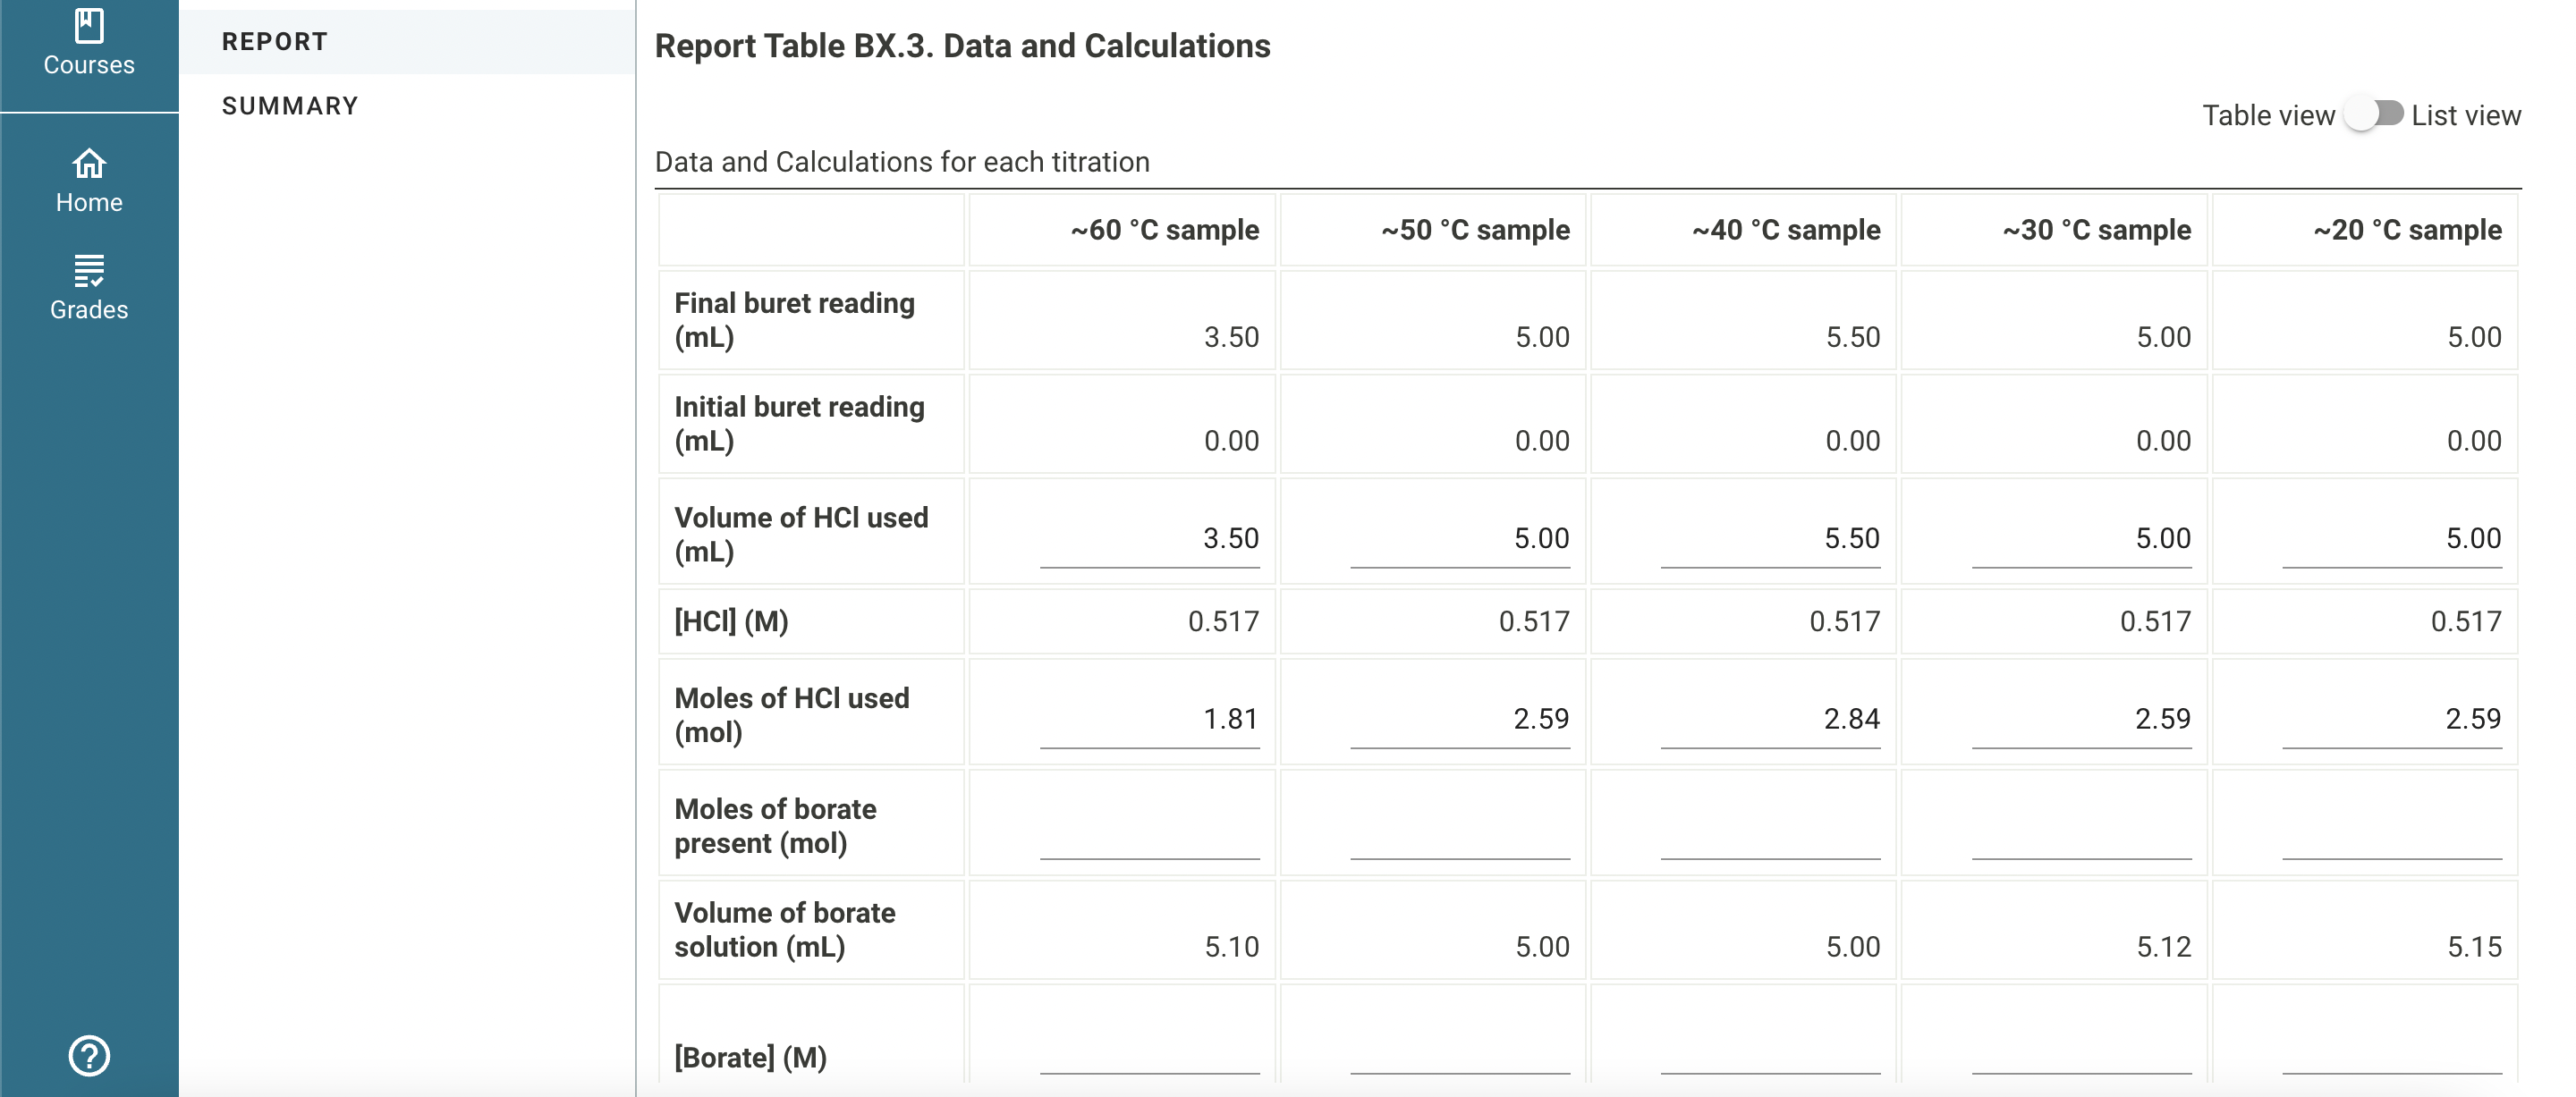
Report Table BX.3. Data and Calculations Table view List view Data and Calculations for each titration
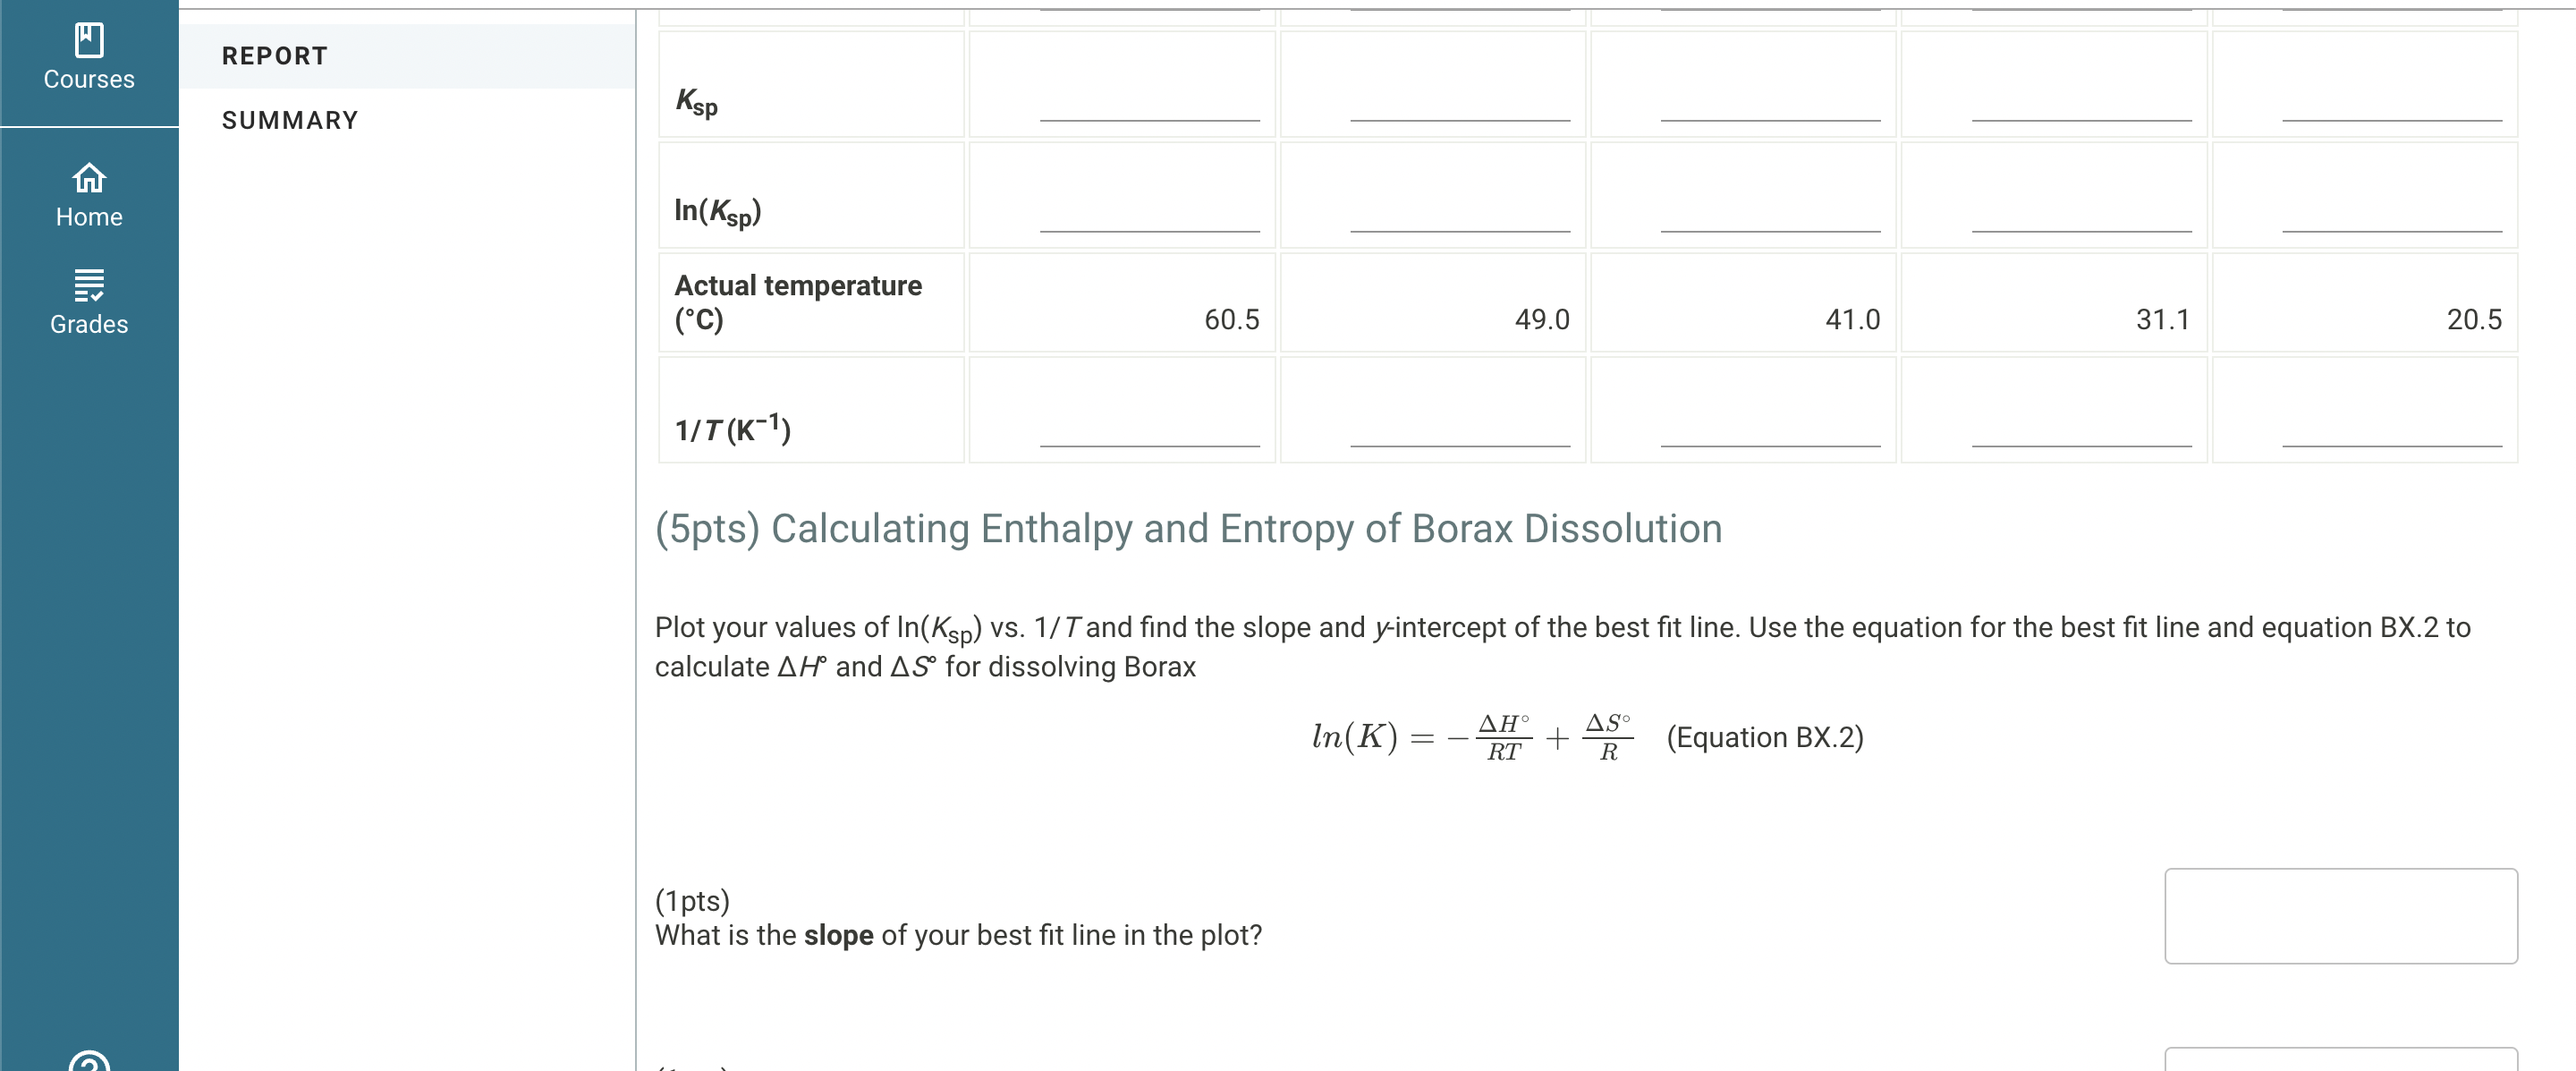
(5pts) Calculating Enthalpy and Entropy of Borax Dissolution Plot your values of vs. and find the slope and -intercept of the best fit line. Use the equation for the best fit line and equation to calculate and for dissolving Borax (1pts) What is the slope of your best fit line in the plot?
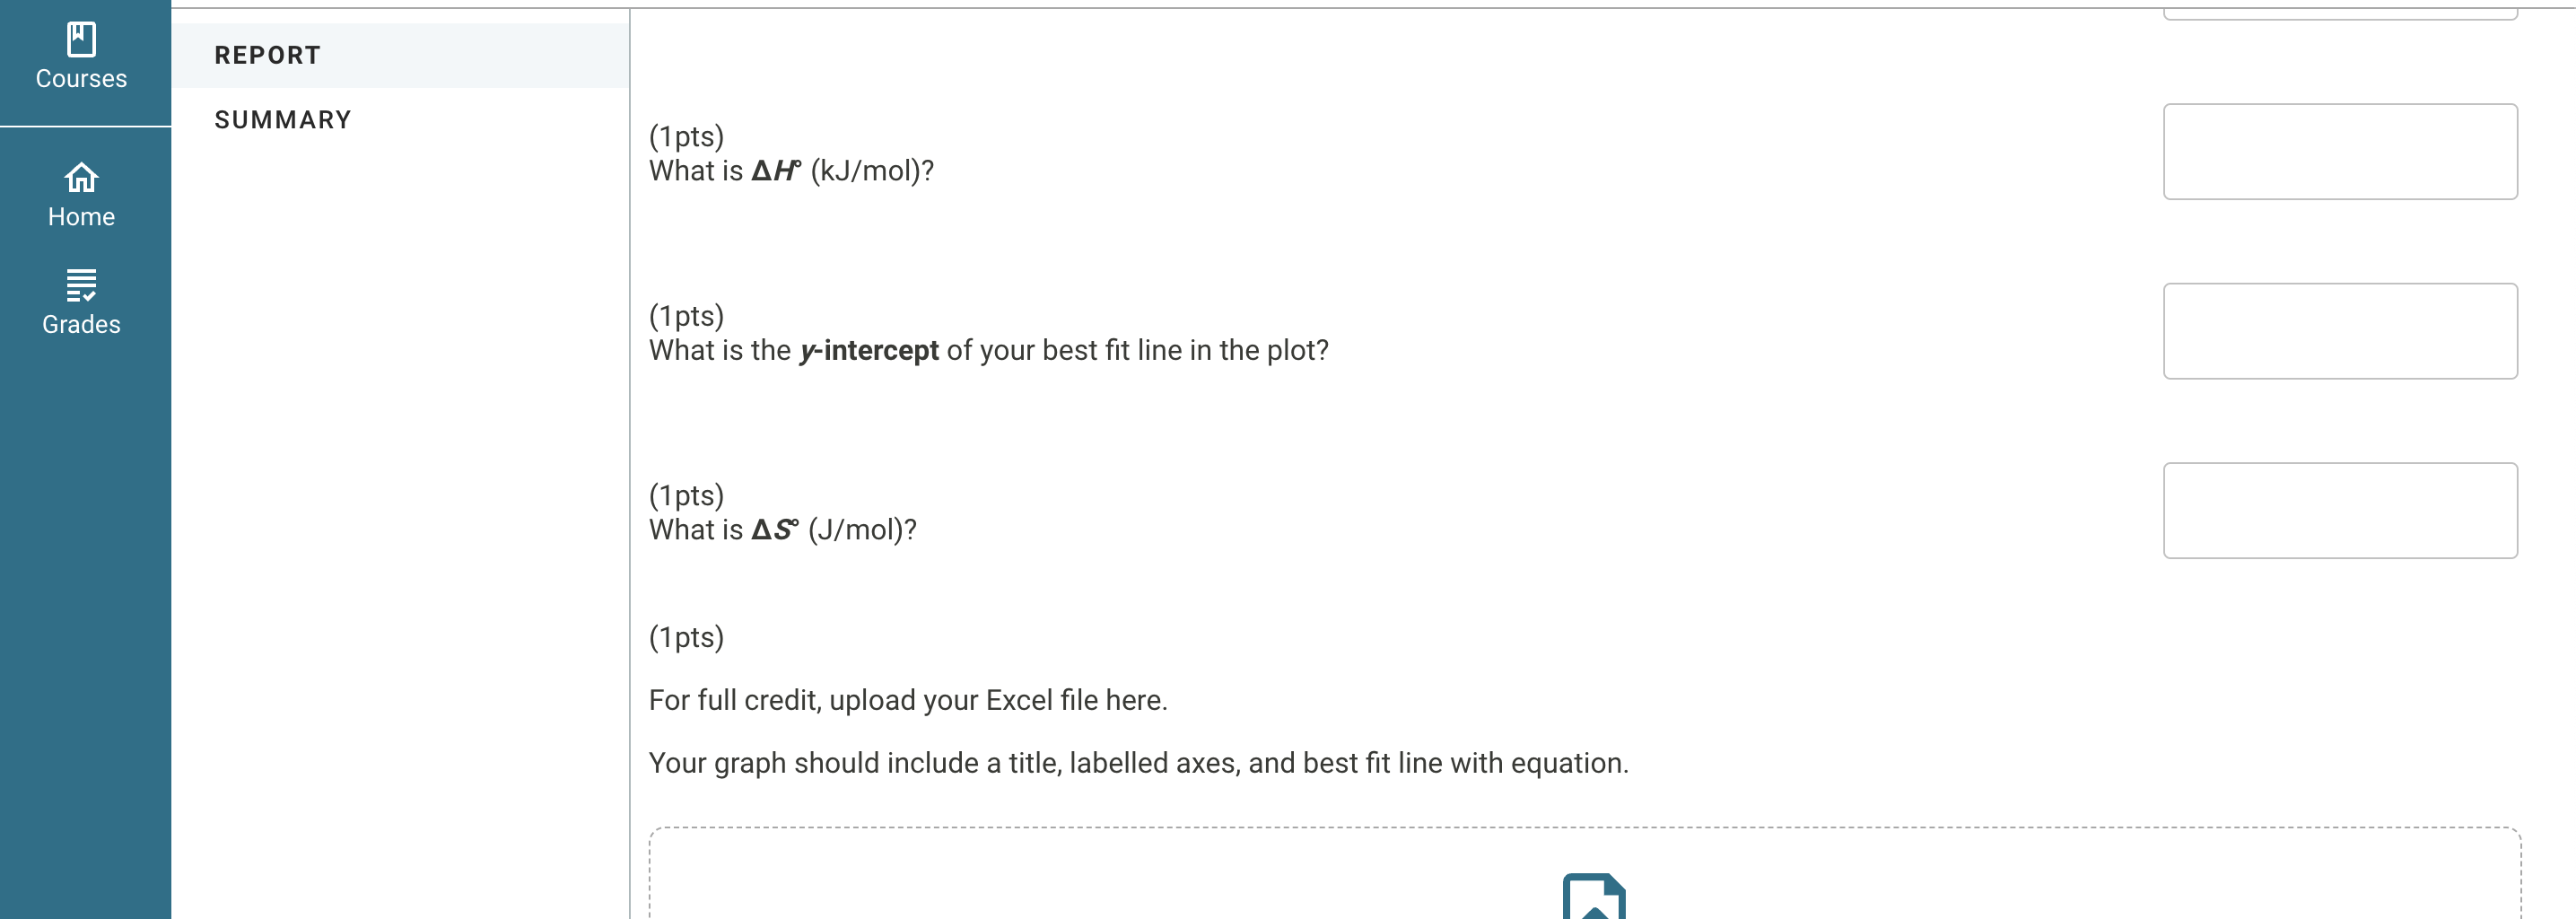
Courses ? Home Grades REPORT SUMMARY (1pts) What is the -intercept of your best fit line in the plot? (1pts) What is ? (1pts) For full credit, upload your Excel file here. Your graph should include a title, labelled axes, and best fit line with equation. (1pts) What is ? -intercept of your best fit line in the plot? What is ? 1pts) For full credit, upload your Excel file here.