Home /
Expert Answers /
Computer Science /
review-the-image-labeled-figure-2-data-points-you-are-asked-to-cluster-the-data-which-is-repres-pa928
(Solved): Review the image labeled Figure 2: Data Points. You are asked to cluster the data, which is repres ...
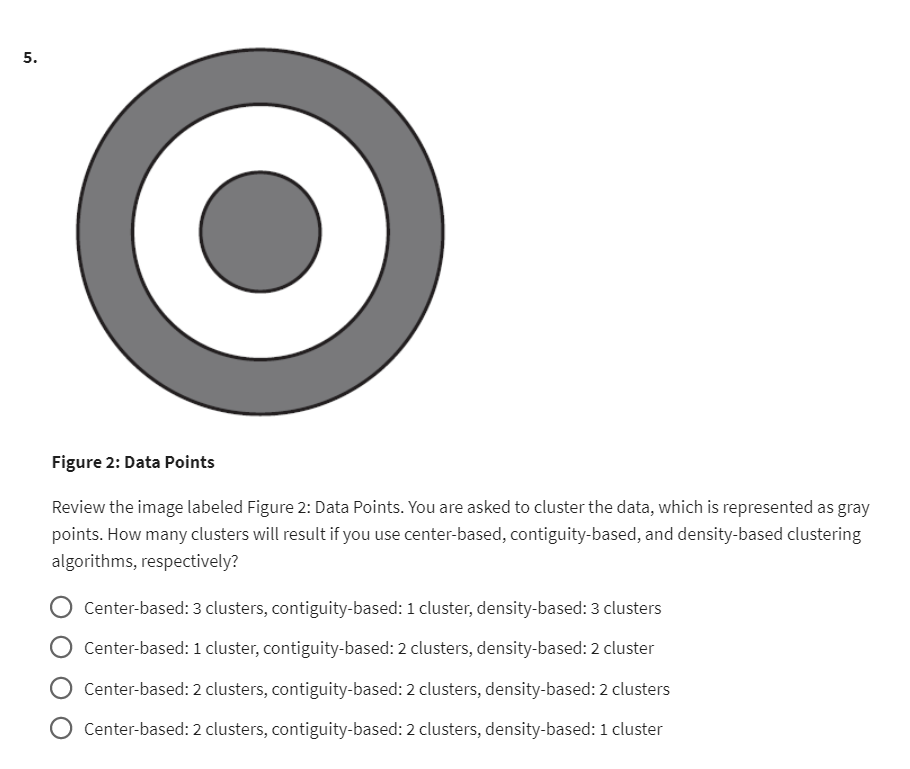
Review the image labeled Figure 2: Data Points. You are asked to cluster the data, which is represented as gray points. How many clusters will result if you use center-based, contiguity-based, and density-based clustering algorithms, respectively? Center-based: 3 clusters, contiguity-based: 1 cluster, density-based: 3 clusters Center-based: 1 cluster, contiguity-based: 2 clusters, density-based: 2 cluster Center-based: 2 clusters, contiguity-based: 2 clusters, density-based: 2 clusters Center-based: 2 clusters, contiguity-based: 2 clusters, density-based: 1 cluster
Expert Answer
Answer) The correct option is option 2. The number of clusters resulting in each of the algorithams are following. Center- based :1 cluster [At each ite