Home /
Expert Answers /
Statistics and Probability /
scatterplot-and-regression-output-dependent-variable-is-rate-r-squared-77-6-quad-s-1-232-pa835
(Solved): Scatterplot and Regression Output Dependent variable is Rate R-squared \( =77.6 \% \quad s=1.232 \) ...

Scatterplot and Regression Output Dependent variable is Rate R-squared \( =77.6 \% \quad s=1.232 \)
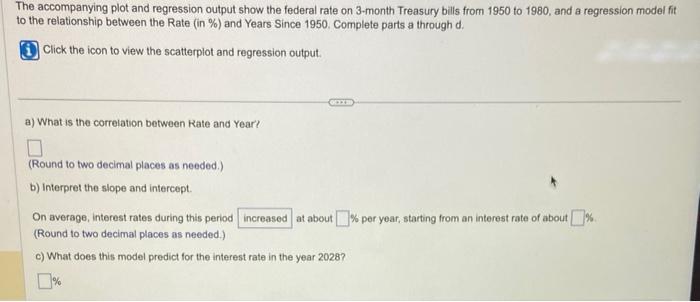
The accompanying plot and regression output show the federal rate on 3-month Treasury bills from 1950 to 1980 , and a regression model fit to the relationship between the Rate (in \%) and Years Since 1950. Complete parts a through \( d \). Click the icon to view the scatterplot and regression output. a) What is the correlation between Rate and Year? (Round to two decimal places as needed.) b) Interpret the slope and intercept. On average, interest rates during this period at about \% per year, starting from an interest rate of about (Round to two decimal places as needed.) c) What does this model predict for the interest rate in the year 2028 ?
Expert Answer
We have given the value of R2 = 0.776 the value of correlation co