(Solved): Scenario Your manager has requested your help to find out how well (or not) your call center is fun ...
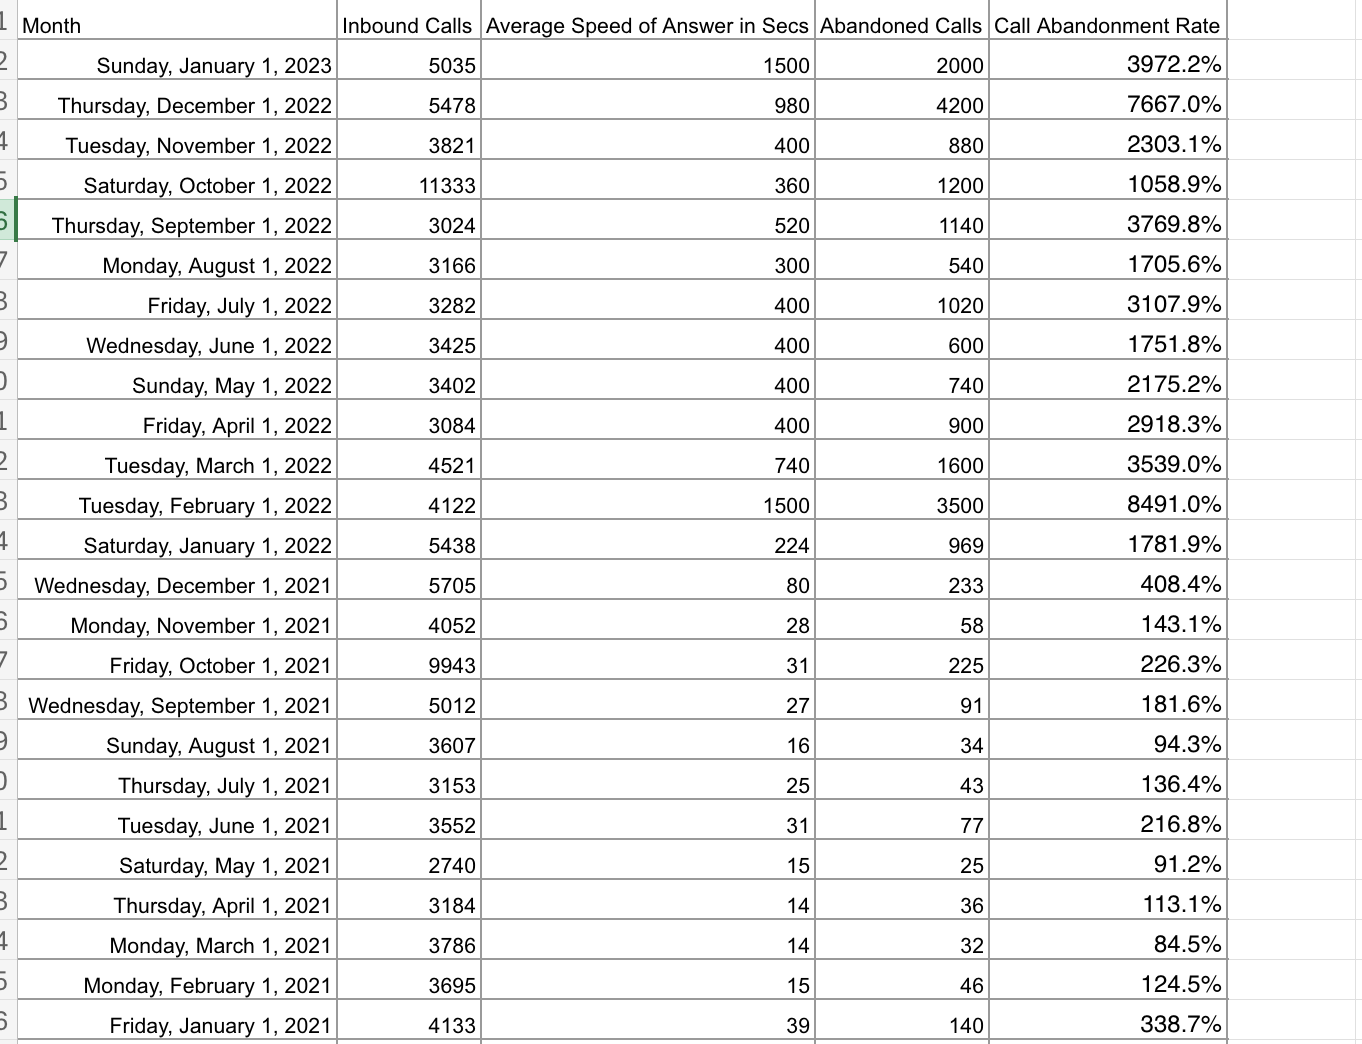
Scenario Your manager has requested your help to find out how well (or not) your call center is functioning. You are provided with a file with some data for each month the call-center has been in business. (The Month column contains dates but they are showing up as numbers—can you please fix that? ????) Please use the Recommendations sheet to convey what you feel are the four most important insights your analysis of the data provides. In your written insights, please reference at least one of the charts you have created that supports your insights. Please deliver one insight for each of the metrics defined below. Inbound Calls – how many calls has the call center received in that month? Average Speed of Answer in Seconds – how many seconds does it take for a caller to be connected with a person? Abandoned Calls – how many callers hang up before the end of the conversation? Call Abandonment Rate – (you need to calculate this using the data above) it should show the percent of inbound calls where callers hang up before the end of the conversation. Begin by thinking of yourself as the owner of this call center. How would you judge your success based on this data? What would the data have to show for you to say that you have improved? What would be some actions you could take to improve (or maintain) the recorded results? This video, which is from an unrelated project, may help you to answer the question "What is an insight?Links to an external site." (it is not required to watch this video). Requirements Please note that as we progress farther into the semester, project requirements will be less prescriptive (meaning fewer exact step-by-step directions like "do this" and "do that") to allow you space to creatively solve problems and improve critical thinking skills. Have a Charts sheet that includes at least one chart for each of the four metrics. Provide four insights based on what patterns you recognize in the data. Your manager would also like a simple dashboard that shows the data for a specific month / year. Create a Dashboard sheet that includes a drop?down list for picking the month / year.Use look-up functions to display the Inbound Calls, Average Speed of Answer in Secs, Abandoned Calls, and Call Abandonment Rate. Format all of the charts to look professional, including adding axis labels and chart titles. Across all of your worksheets, remember to use the Standards of ProfessionalismLinks to an external site., including naming the sheets in your workbook so they are recognizable for the users. \begin{tabular}{|c|c|c|c|c|} \hline Month & Inbound Calls & Average Speed of Answer in Secs & Abandoned Calls & Call Abandonment Rate \\ \hline Sunday, January 1, 2023 & 5035 & 1500 & 2000 & 3972.2\% \\ \hline Thursday, December 1, 2022 & 5478 & 980 & 4200 & 7667.0\% \\ \hline Tuesday, November 1, 2022 & 3821 & 400 & 880 & 2303.1\% \\ \hline Saturday, October 1, 2022 & 11333 & 360 & 1200 & 1058.9\% \\ \hline Thursday, September 1,2022 & 3024 & 520 & 1140 & 3769.8\% \\ \hline Monday, August 1, 2022 & 3166 & 300 & 540 & 1705.6\% \\ \hline Friday, July 1, 2022 & 3282 & 400 & 1020 & 3107.9\% \\ \hline Wednesday, June 1, 2022 & 3425 & 400 & 600 & 1751.8\% \\ \hline Sunday, May 1, 2022 & 3402 & 400 & 740 & 2175.2\% \\ \hline Friday, April 1, 2022 & 3084 & 400 & 900 & 2918.3\% \\ \hline Tuesday, March 1, 2022 & 4521 & 740 & 1600 & 3539.0\% \\ \hline Tuesday, February 1, 2022 & 4122 & 1500 & 3500 & 8491.0\% \\ \hline Saturday, January 1, 2022 & 5438 & 224 & 969 & 1781.9\% \\ \hline Wednesday, December 1,2021 & 5705 & 80 & 233 & 408.4\% \\ \hline Monday, November 1, 2021 & 4052 & 28 & 58 & 143.1\% \\ \hline Friday, October 1, 2021 & 9943 & 31 & 225 & 226.3\% \\ \hline Wednesday, September 1,2021 & 5012 & 27 & 91 & 181.6\% \\ \hline Sunday, August 1, 2021 & 3607 & 16 & 34 & 94.3\% \\ \hline Thursday, July 1, 2021 & 3153 & 25 & 43 & 136.4\% \\ \hline Tuesday, June 1, 2021 & 3552 & 31 & 77 & 216.8\% \\ \hline Saturday, May 1, 2021 & 2740 & 15 & 25 & 91.2\% \\ \hline Thursday, April 1, 2021 & 3184 & 14 & 36 & 113.1\% \\ \hline Monday, March 1, 2021 & 3786 & 14 & 32 & 84.5\% \\ \hline Monday, February 1, 2021 & 3695 & 15 & 46 & 124.5\% \\ \hline Friday, January 1, 2021 & 4133 & 39 & 140 & 338.7\% \\ \hline \end{tabular}
