Home /
Expert Answers /
Statistics and Probability /
scientists-made-detailed-chemical-analyses-of-24-of-the-diamonds-from-ex-2-above-the-abundances-pa139
(Solved): Scientists made detailed chemical analyses of 24 of the diamonds from Ex. 2 (above). The abundances ...
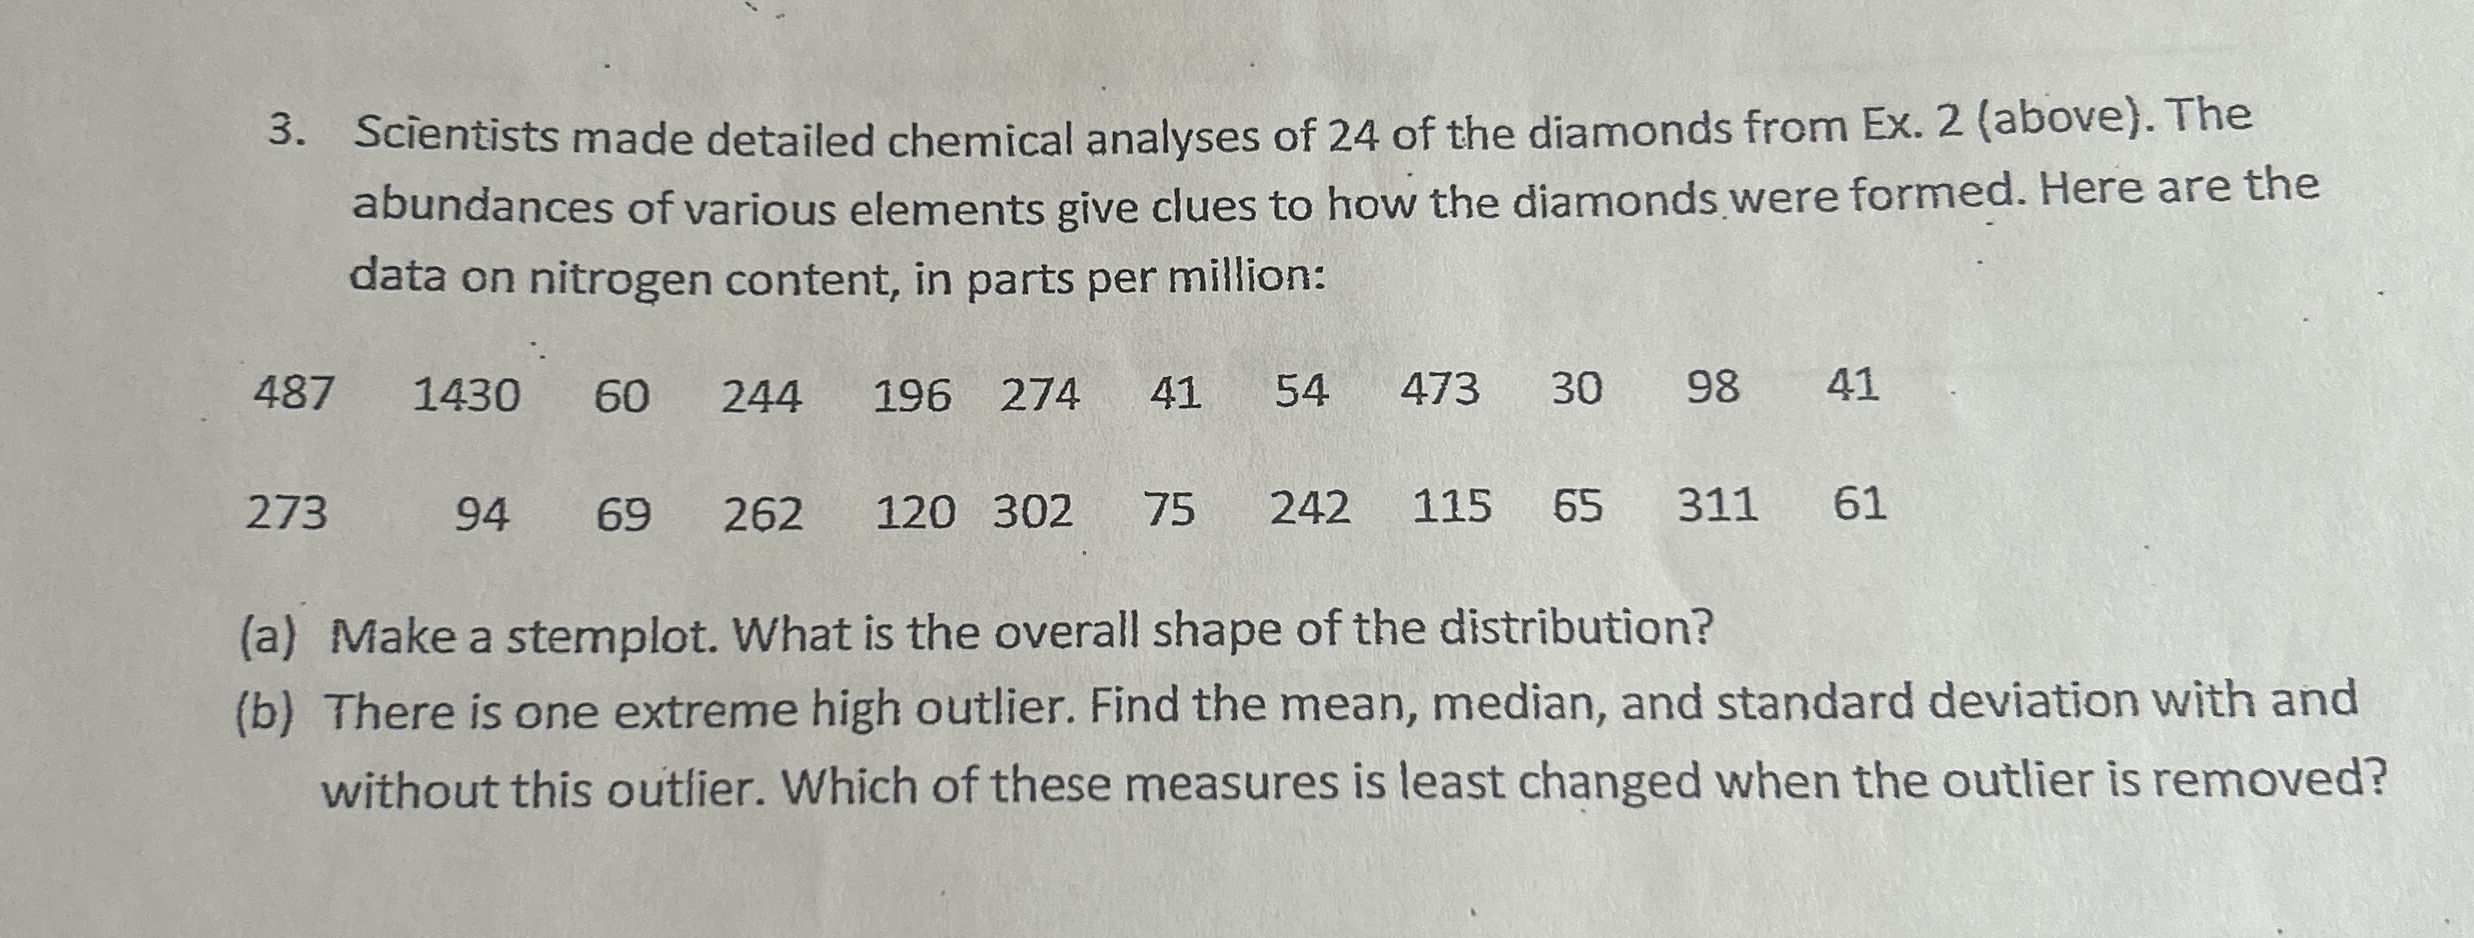
Scientists made detailed chemical analyses of 24 of the diamonds from Ex. 2 (above). The abundances of various elements give clues to how the diamonds were formed. Here are the data on nitrogen content, in parts per million: \table[[487,1430,60,244,196,274,41,54,473,30,98,41],[273,94,69,262,120,302,75,242,115,65,311,61]] (a) Make a stemplot. What is the overall shape of the distribution? (b) There is one extreme high outlier. Find the mean, median, and standard deviation with and without this outlier. Which of these measures is least changed when the outlier is removed?