(Solved): Slope Plot and Histogram Slope Plot and HistogramA study looked at a sample of 35 vehicles to exam ...
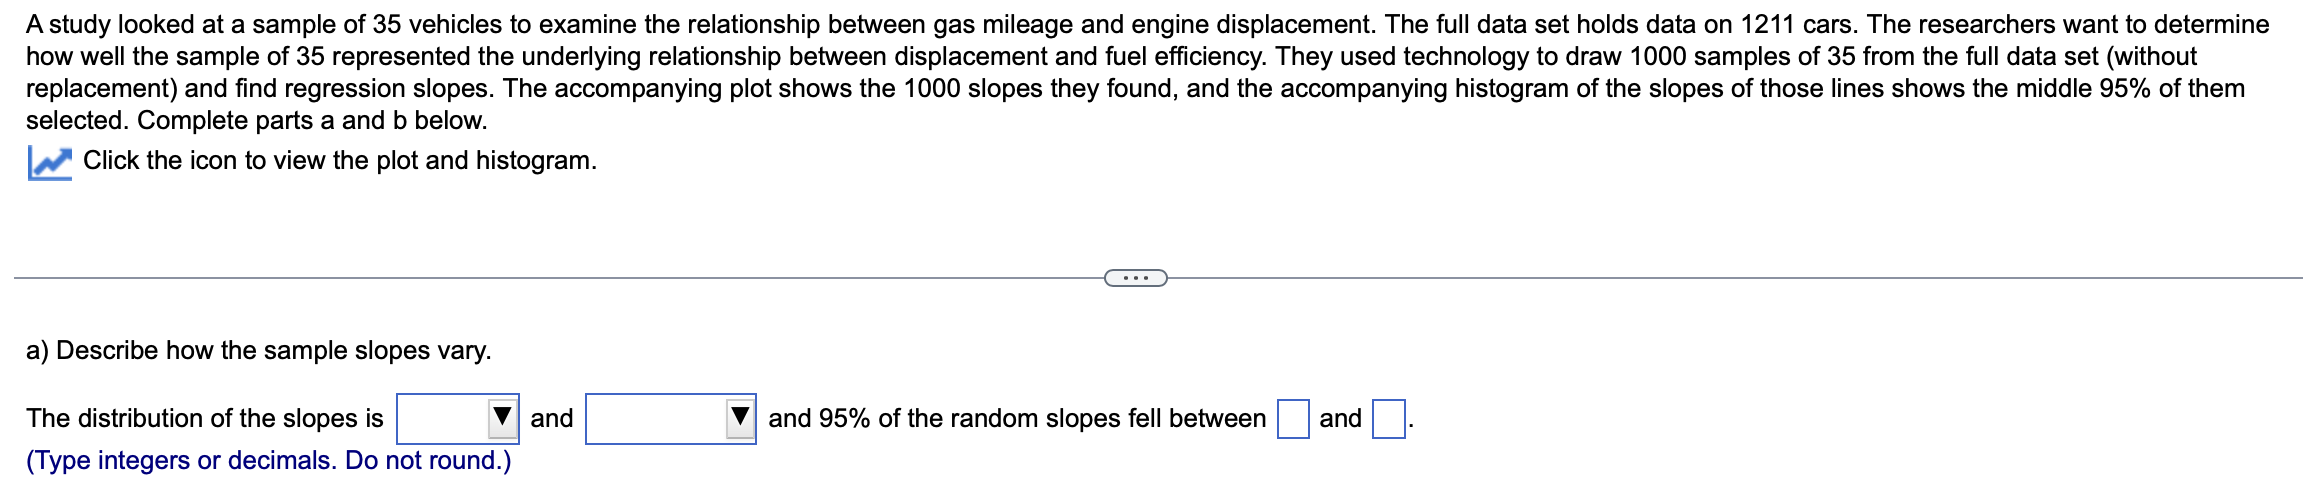
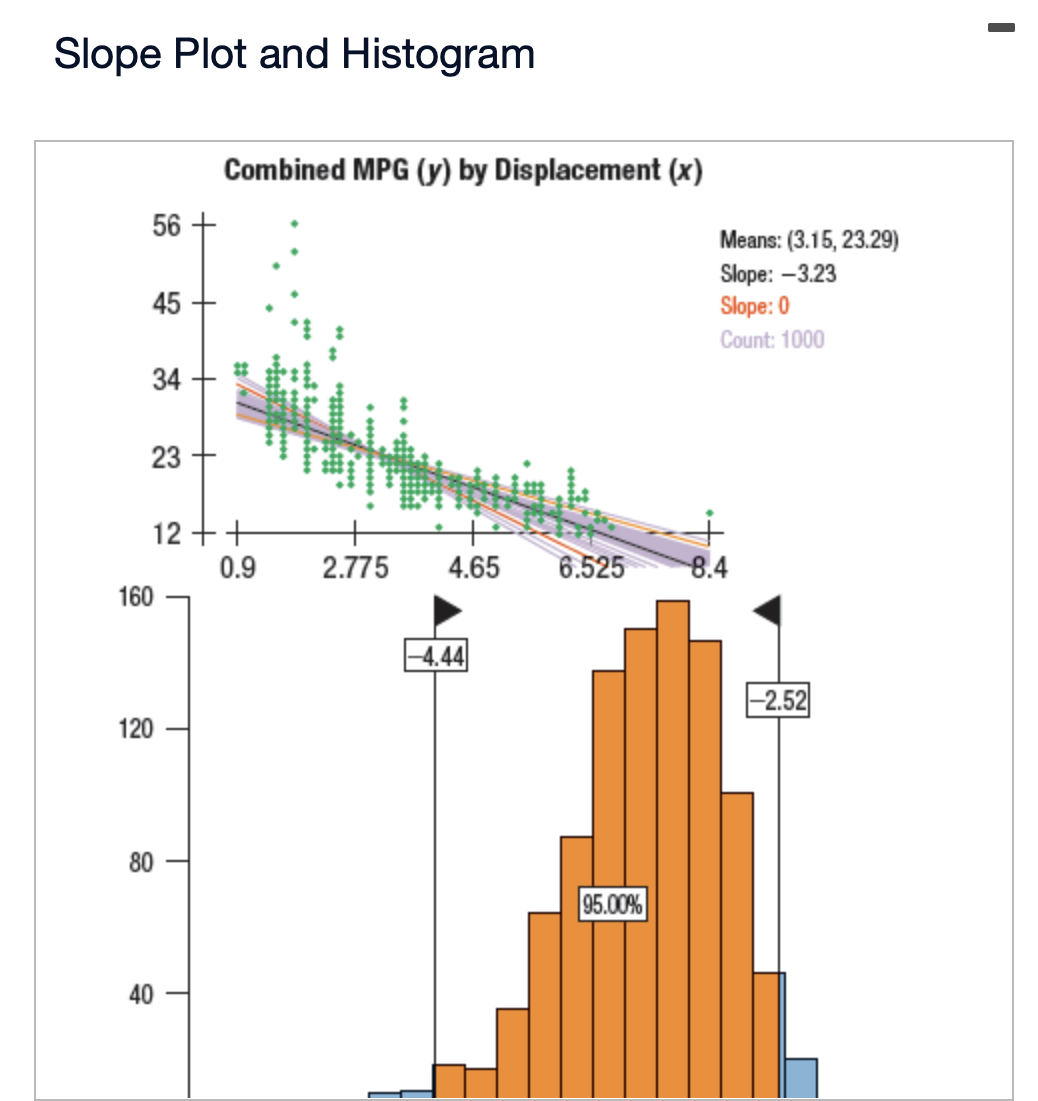
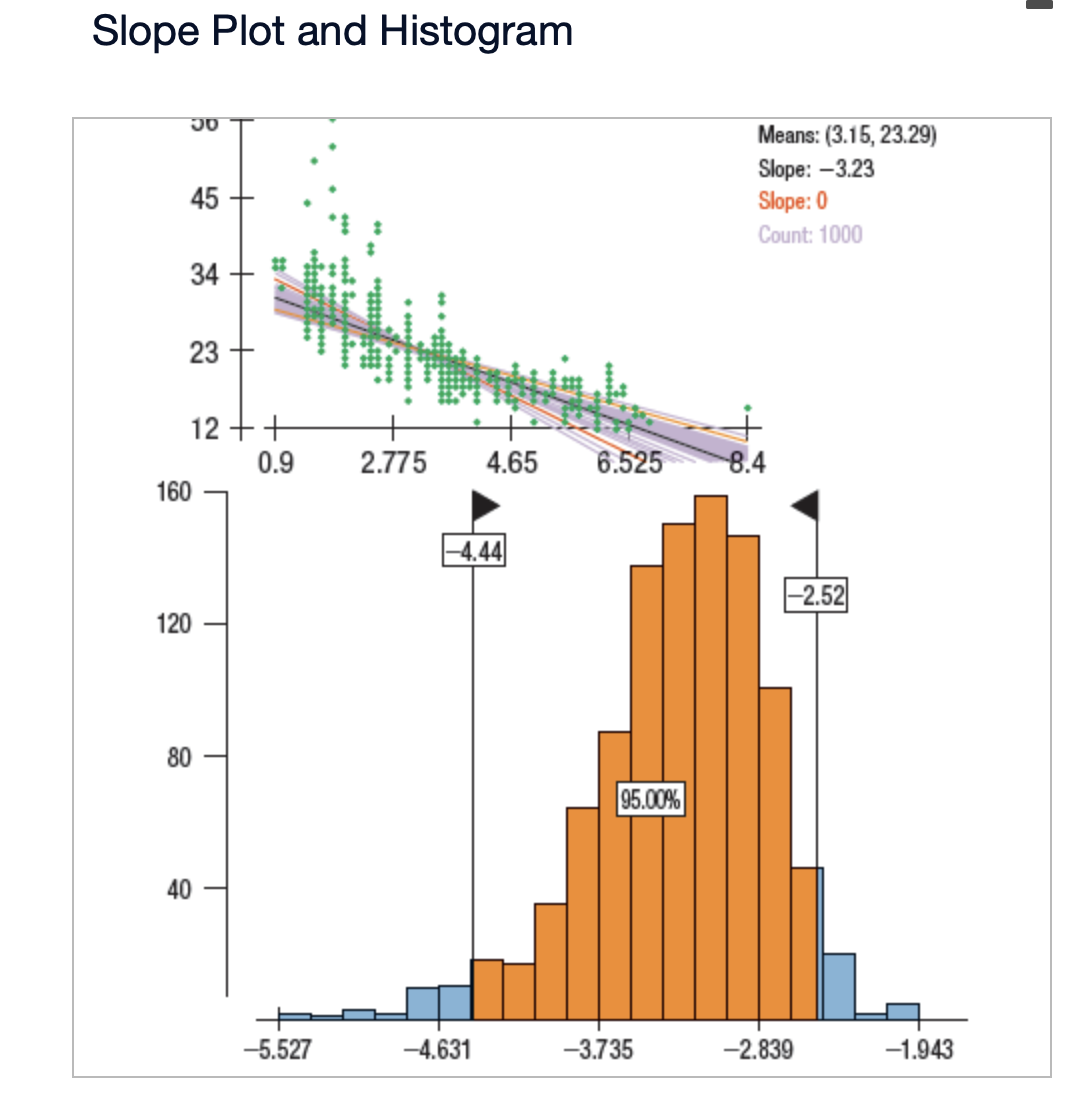
Slope Plot and Histogram Slope Plot and HistogramA study looked at a sample of 35 vehicles to examine the relationship between gas mileage and engine displacement. The full data set holds data on 1211 cars. The researchers want to determine how well the sample of 35 represented the underlying relationship between displacement and fuel efficiency. They used technology to draw 1000 samples of 35 from the full data set (without replacement) and find regression slopes. The accompanying plot shows the 1000 slopes they found, and the accompanying histogram of the slopes of those lines shows the middle
95%of them selected. Complete parts a and b below. Click the icon to view the plot and histogram. a) Describe how the sample slopes vary. The distribution of the slopes is and and
95%of the random slopes fell between and (Type integers or decimals. Do not round.)