Home /
Expert Answers /
Advanced Math /
solve-the-problem-step-by-step-and-show-work-summary-of-the-graphical-solution-procedure-for-mini-pa914
(Solved): solve the problem step by step and show work ! Summary of the Graphical Solution Procedure for Mini ...
solve the problem step by step and show work !
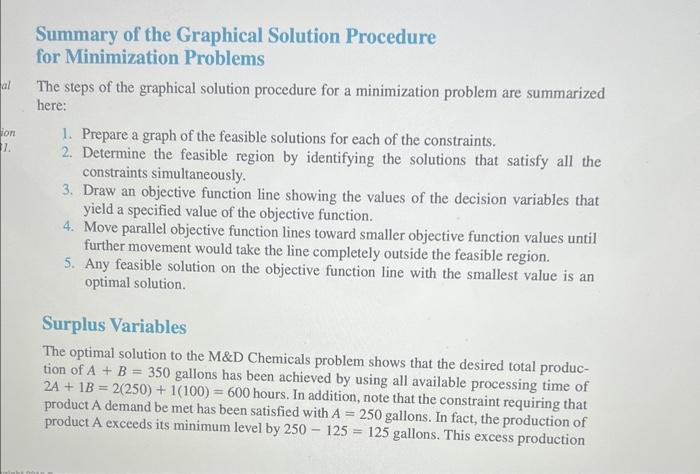
Summary of the Graphical Solution Procedure for Minimization Problems The steps of the graphical solution procedure for a minimization problem are summarized here: 1. Prepare a graph of the feasible solutions for each of the constraints. 2. Determine the feasible region by identifying the solutions that satisfy all the constraints simultaneously. 3. Draw an objective function line showing the values of the decision variables that yield a specified value of the objective function. 4. Move parallel objective function lines toward smaller objective function values until further movement would take the line completely outside the feasible region. 5. Any feasible solution on the objective function line with the smallest value is an optimal solution. Surplus Variables The optimal solution to the M\&D Chemicals problem shows that the desired total production of gallons has been achieved by using all available processing time of hours. In addition, note that the constraint requiring that product demand be met has been satisfied with gallons. In fact, the production of product A exceeds its minimum level by gallons. This excess production
Expert Answer
There is no problem there is just a method given : Problem: At a university, Professor Symons wishes to employ two people, John and Mary, to grade pap