Home /
Expert Answers /
Statistics and Probability /
spss-lab-2the-following-dataset-contains-scores-from-a-sample-of-high-school-students-who-completed-pa813
(Solved): SPSS Lab 2The following dataset contains scores from a sample of high school students who completed ...
SPSS Lab 2
The following dataset contains scores from a sample of high school students who completed the ACT. The ACT is a popular college admissions examination. Scores on the ACT can range from 1 - 36. Create two variables in SPSS, one for ID and one for their ACT score and then answer the following questions. Be sure to create the necessary output, add it to a Word document, and upload it at the end.
DATA IS AT THE END OF THE POST
| ID | ACTscore |
| 1 | 27 |
| 2 | 23 |
| 3 | 22 |
| 4 | 17 |
| 5 | 25 |
| 6 | 22 |
| 7 | 24 |
| 8 | 26 |
| 9 | 30 |
| 10 | 24 |
| 11 | 16 |
| 12 | 32 |
| 13 | 19 |
| 14 | 29 |
| 15 | 25 |
| 16 | 28 |
| 17 | 22 |
| 18 | 32 |
| 19 | 25 |
| 20 | 33 |
| 21 | 23 |
| 22 | 31 |
| 23 | 20 |
| 24 | 26 |
| 25 | 23 |
| 26 | 30 |
| 27 | 27 |
| 28 | 25 |
| 29 | 22 |
| 30 | 19 |
| 31 | 28 |
| 32 | 34 |
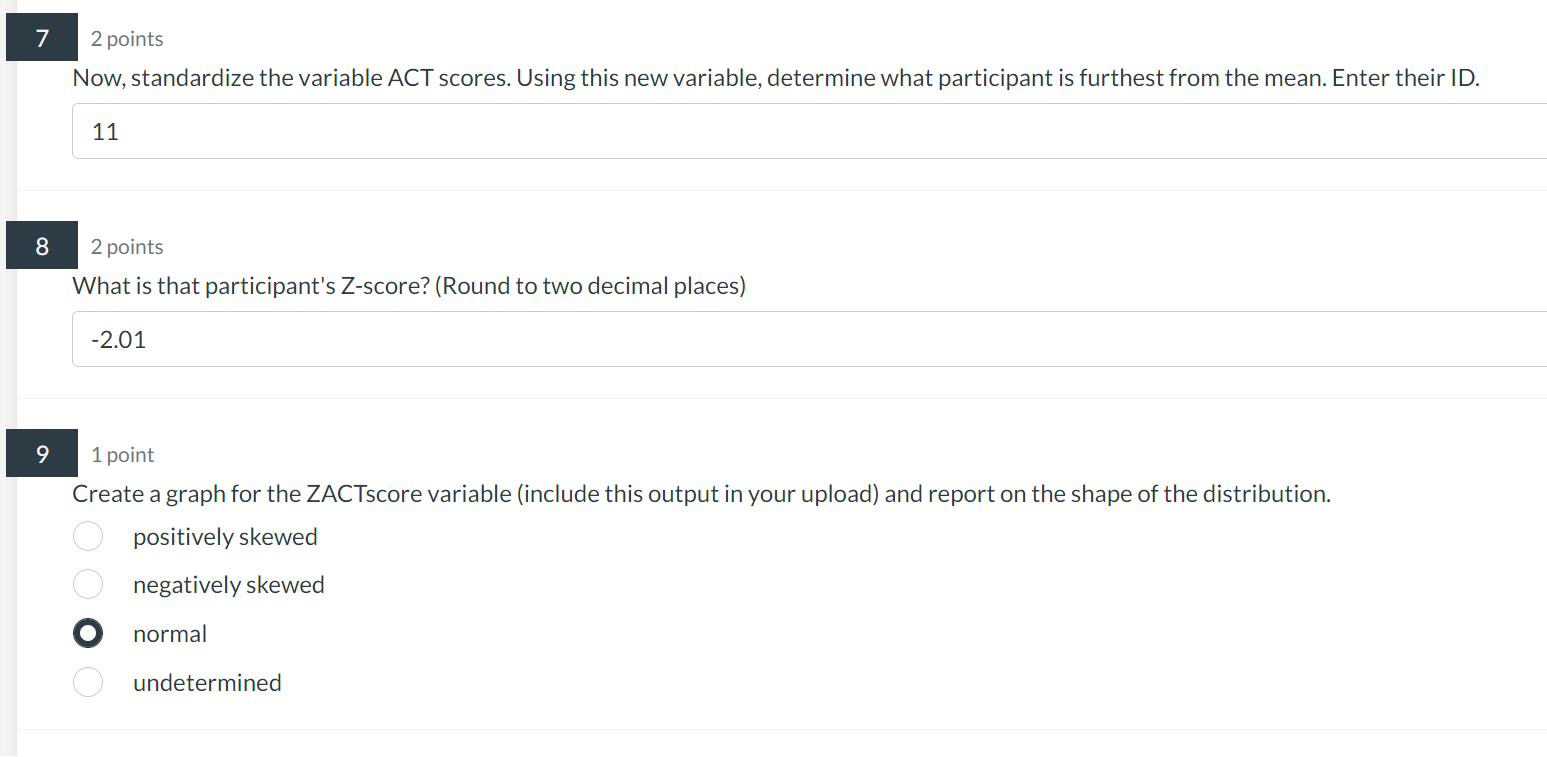
2 points Now, standardize the variable ACT scores. Using this new variable, determine what participant is furthest from the mean. Enter their ID. 11 2 points What is that participant's Z-score? (Round to two decimal places) 1 point Create a graph for the ZACTscore variable (include this output in your upload) and report on the shape of the distribution. positively skewed negatively skewed normal undetermined
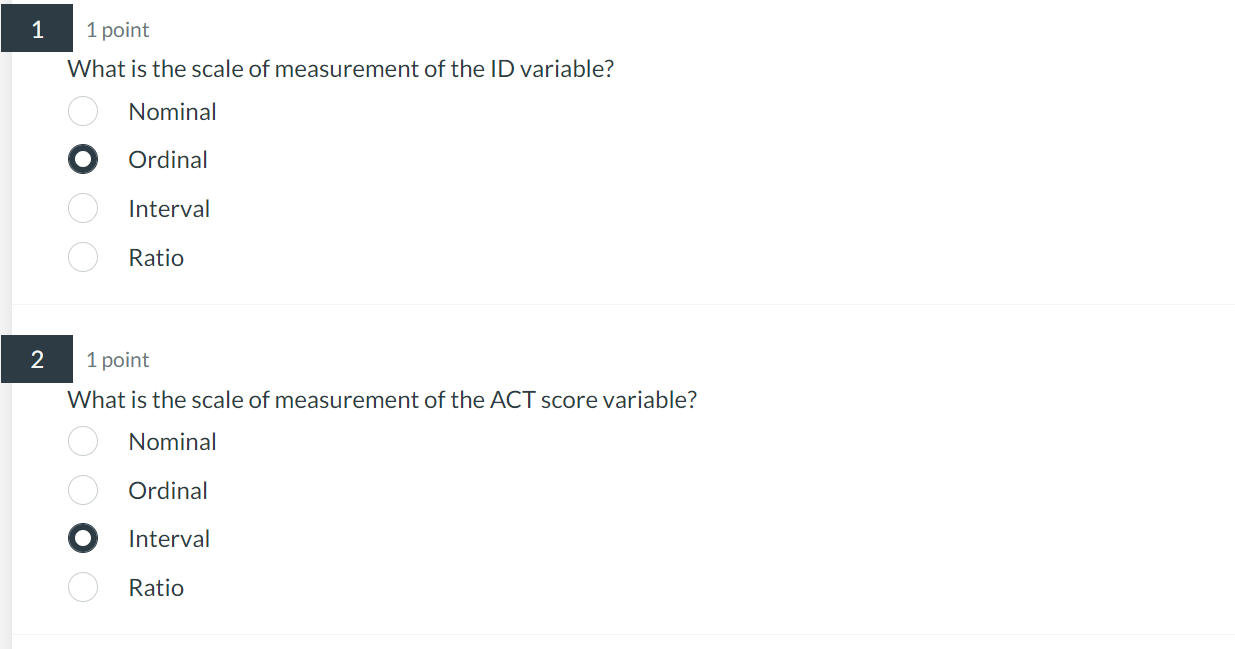
What is the scale of measurement of the ID variable? Nominal Ordinal Interval Ratio 1 point What is the scale of measurement of the ACT score variable? Nominal Ordinal Interval Ratio
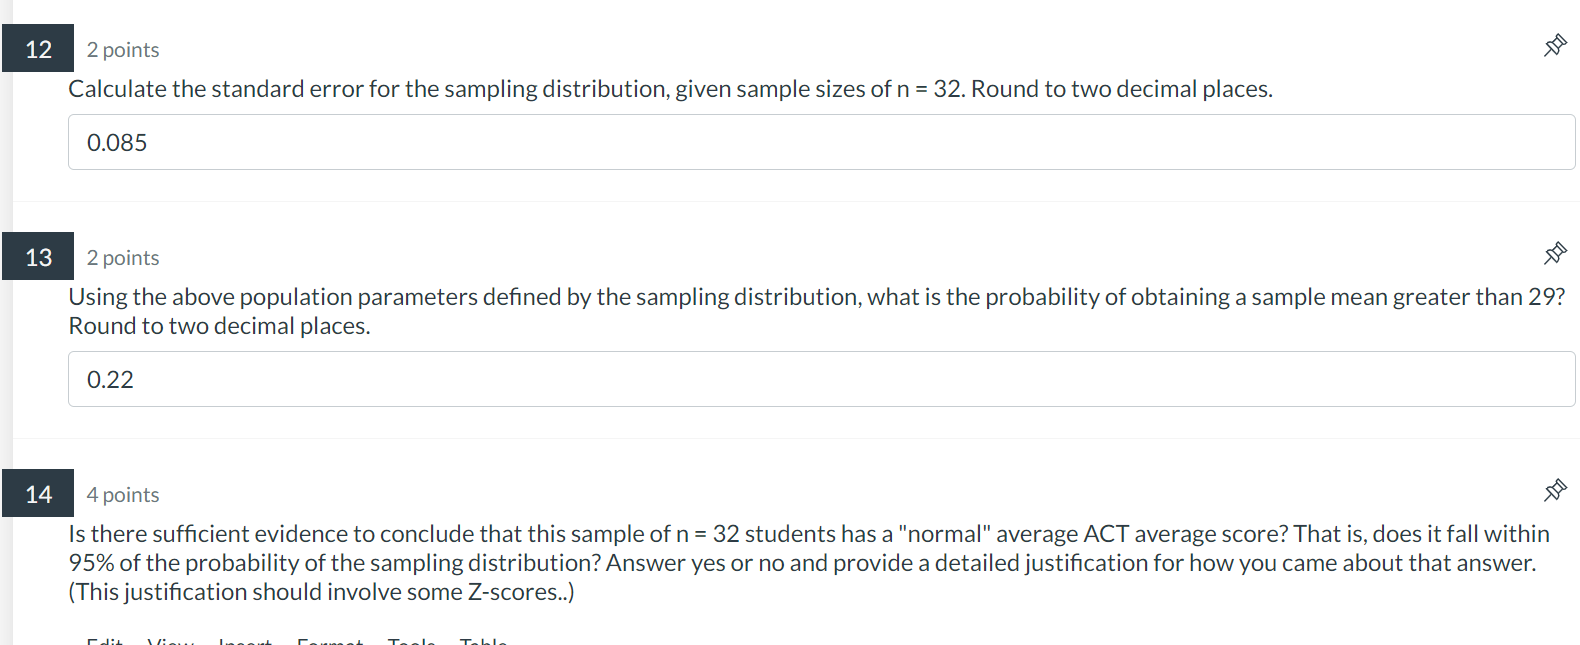
Calculate the standard error for the sampling distribution, given sample sizes of . Round to two decimal places. 0.085 2 points Using the above population parameters defined by the sampling distribution, what is the probability of obtaining a sample mean greater than 29 ? Round to two decimal places. 0.22 4 points Is there sufficient evidence to conclude that this sample of students has a "normal" average ACT average score? That is, does it fall within of the probability of the sampling distribution? Answer yes or no and provide a detailed justification for how you came about that answer. (This justification should involve some Z-scores..)
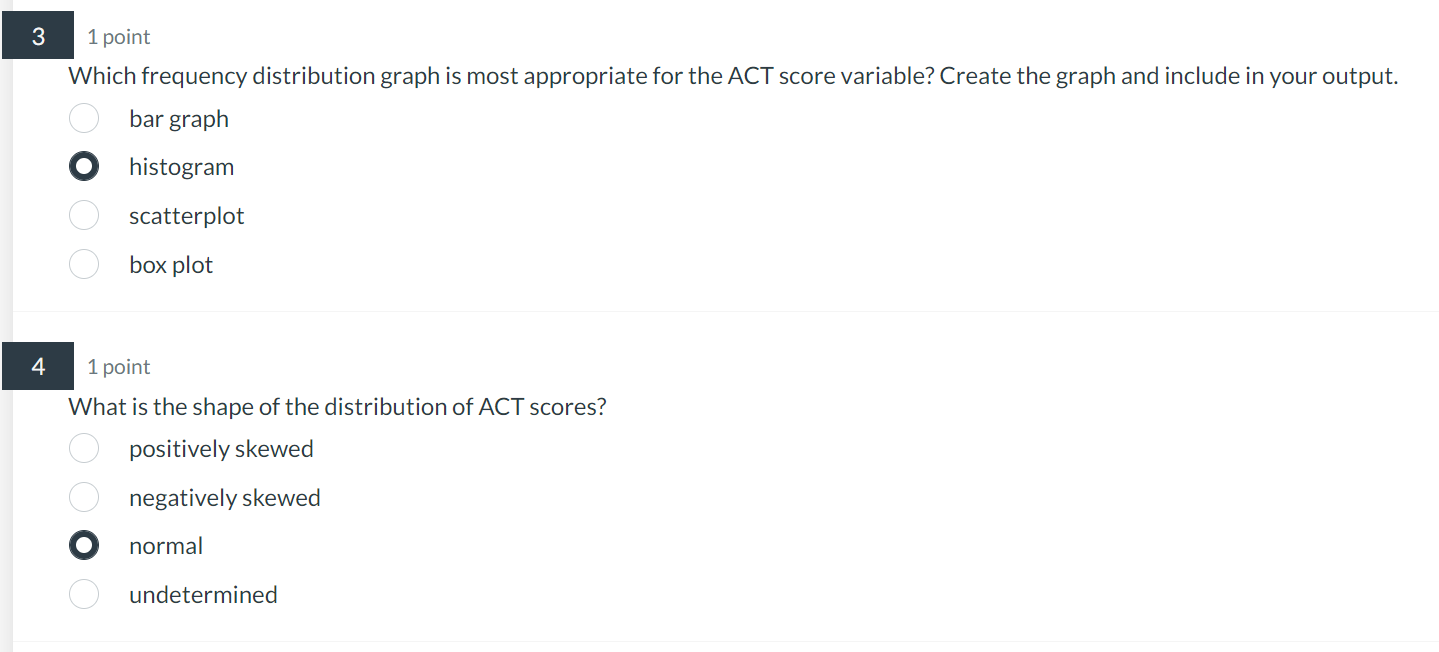
Which frequency distribution graph is most appropriate for the ACT score variable? Create the graph and include in your output. bar graph histogram scatterplot box plot 1 point What is the shape of the distribution of ACT scores? positively skewed negatively skewed normal undetermined
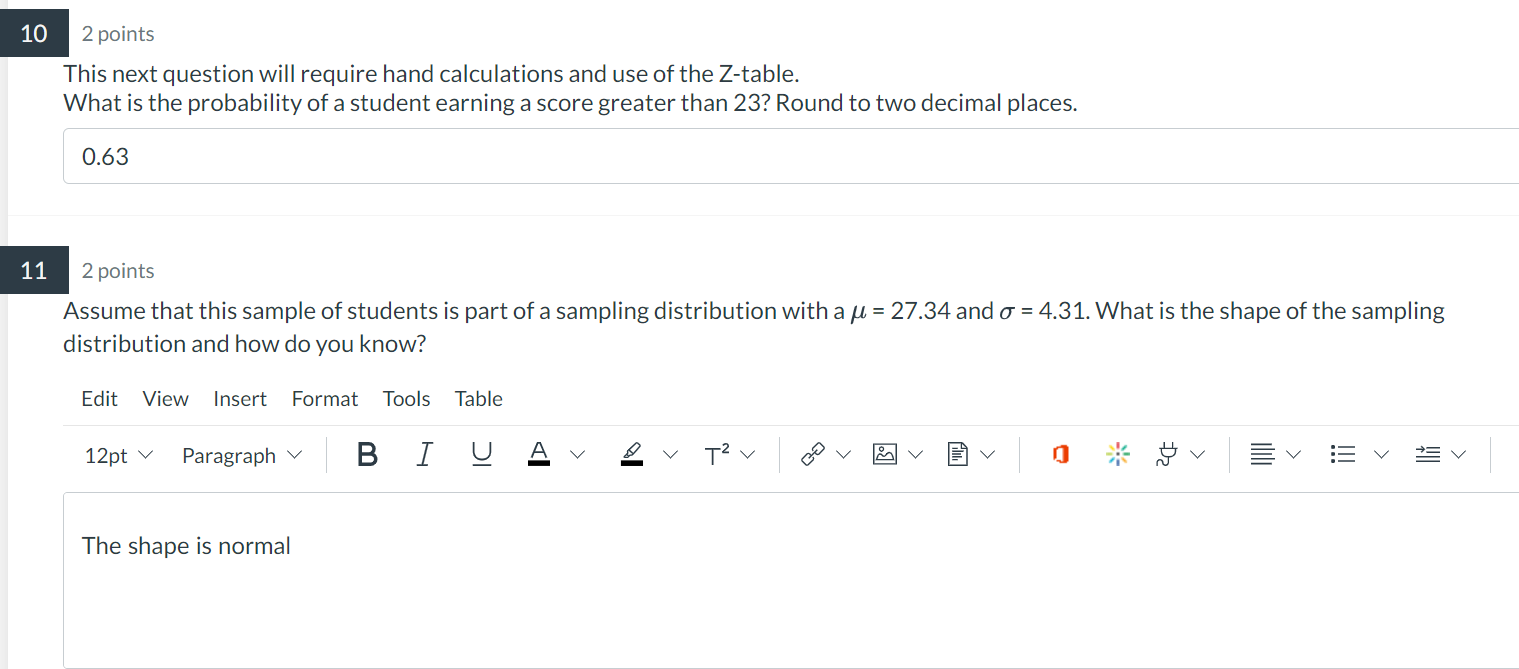
2 points This next question will require hand calculations and use of the Z-table. What is the probability of a student earning a score greater than 23 ? Round to two decimal places. 0.63 2 points Assume that this sample of students is part of a sampling distribution with a and . What is the shape of the sampling distribution and how do you know?
Calculate the standard error for the sampling distribution, given sample sizes of . Round to two decimal places. 0.085 2 points Using the above population parameters defined by the sampling distribution, what is the probability of obtaining a sample mean greater than 29 ? Round to two decimal places. 0.22 4 points Is there sufficient evidence to conclude that this sample of students has a "normal" average ACT average score? That is, does it fall within of the probability of the sampling distribution? Answer yes or no and provide a detailed justification for how you came about that answer. (This justification should involve some Z-scores..)
2 points Now, standardize the variable ACT scores. Using this new variable, determine what participant is furthest from the mean. Enter their ID. 11 2 points What is that participant's Z-score? (Round to two decimal places) 1 point Create a graph for the ZACTscore variable (include this output in your upload) and report on the shape of the distribution. positively skewed negatively skewed normal undetermined
What is the scale of measurement of the ID variable? Nominal Ordinal Interval Ratio 1 point What is the scale of measurement of the ACT score variable? Nominal Ordinal Interval Ratio
Which frequency distribution graph is most appropriate for the ACT score variable? Create the graph and include in your output. bar graph histogram scatterplot box plot 1 point What is the shape of the distribution of ACT scores? positively skewed negatively skewed normal undetermined
2 points This next question will require hand calculations and use of the Z-table. What is the probability of a student earning a score greater than 23 ? Round to two decimal places. 0.63 2 points Assume that this sample of students is part of a sampling distribution with a and . What is the shape of the sampling distribution and how do you know?