Home /
Expert Answers /
Statistics and Probability /
table-non-smoker-smoker-table-number-of-patients-death-table-mortality-rate-per-1000-pa709
(Solved): \table[[Non-smoker,Smoker],[\table[[Number],[of patients]],Death,\table[[Mortality rate per],[1000 ...
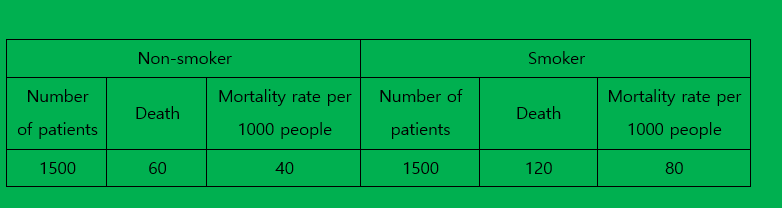
\table[[Non-smoker,Smoker],[\table[[Number],[of patients]],Death,\table[[Mortality rate per],[1000 people]],\table[[Number of],[patients]],Death,\table[[Mortality rate per],[1000 people]]],[1500,60,40,1500,120,80]].3-2. In the table below, if the smoking rate of the population group to which the research data belongs is 50%, determine the population attributable risk.