Home /
Expert Answers /
Statistics and Probability /
the-annual-amounts-of-rainfall-in-a-certain-region-are-modeled-using-the-normal-distribution-shown-b-pa302
(Solved): The annual amounts of rainfall in a certain region are modeled using the normal distribution shown b ...
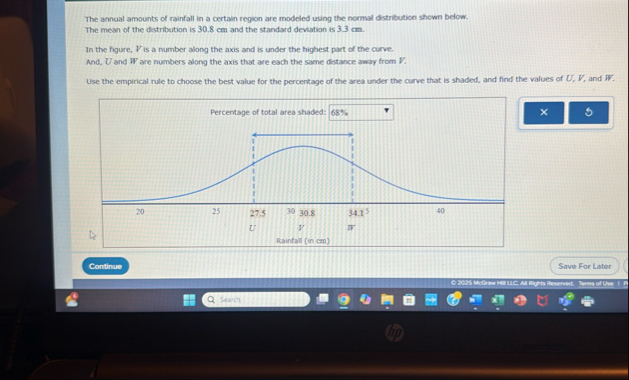
The annual amounts of rainfall in a certain region are modeled using the normal distribution shown below. The mean of the distribution is 30.8 cm and the standard deviation is
3.3cm. In the figure,
Vis a number along the axis and is under the highest part of the curve. And,
Uand
Ware numbers along the axis that are each the same distance away from
V. Use the empirical rule to choose the best value for the percentage of the area under the curve that is shaded, and find the values of
U,
V, and
W. Search