Home /
Expert Answers /
Advanced Math /
the-applet-above-shows-the-graph-of-the-continuous-compounding-model-a-t-2600e0-0643-in-green-wi-pa324
(Solved): The applet above shows the graph of the continuous compounding model A(t)=2600e0.0643 In green wi ...
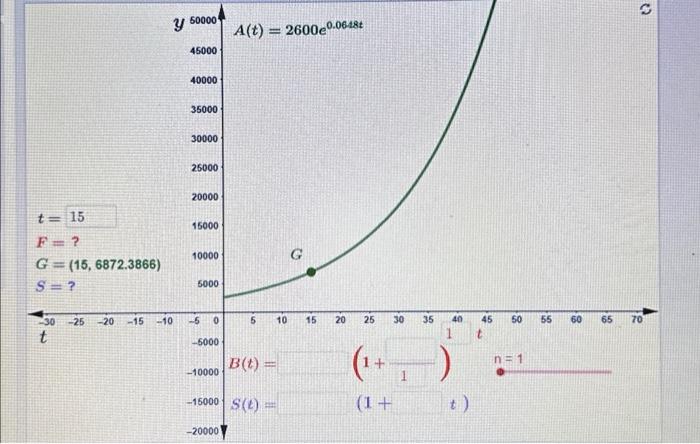
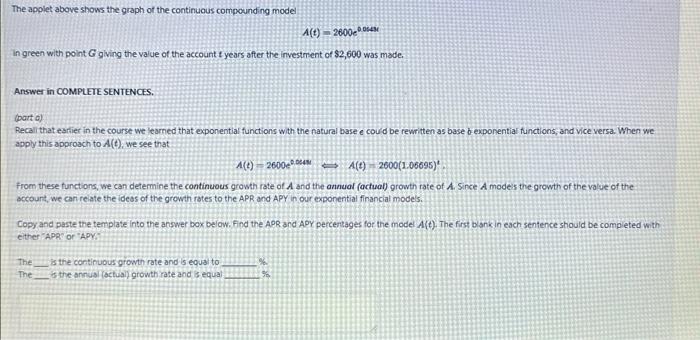
The applet above shows the graph of the continuous compounding model In green with point giving the value of the account it years after the investrent of was made. Answer in COMPLETE SENTENCES. (part a) Recali that eartier in the course we learned that exponential functions with the natural base e could be rewritten as base b-exponential functions, and vice versa. When we apply this approach to , we see that from these functions, we can determine the continuous growth rate of and the annual (actual) growth rate of . Since modes the growth of the value of the accours, we cari reiate the idess of the growth rates to the APR and APY in our exponential financial models. Copy and paste the template into the answer box below. Find the APR and AOY percersages for the model . The first blankin each sentence should be completed with either "APR" or "APY:" The is the continuous growth rate and is equar to The _ is the annus (octuai) growth rate and is equa)
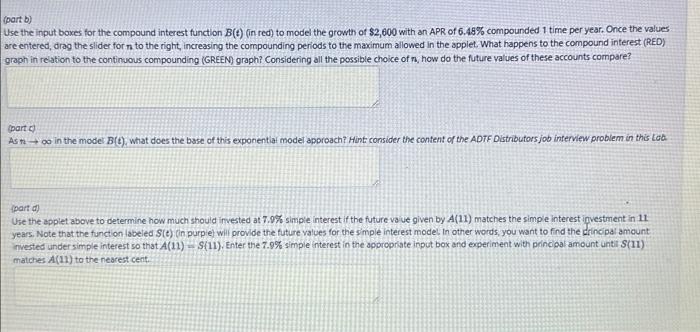
part b) Jse the input boxes for the compound interest function (in red) to model the growth of with an APR of compounded 1 time per year. Once the values are entered, drag the slider for to the right, increasing the compounding periods to the maximum allowed in the applet. What happens to the compound interest (RED) graph in relation to the continuous compounding (GREEN) graph? Considering all the possible choice of , how do the future values of these accounts compare? (parte) As in the model , what does the base of this exponentlat model approach? Hint consider the content of the ADTF Distributors job interview problem in this Lob: (part d) Use the appiet above to determine how much should invested at simple interest if the future vaue given by matches the simple interest igvestment in 11 years. Note that the function labeled (in purple) will provide the future values for the simple interest model. in other words; you want to find the drincipai amount invested under simple interest so that , Enter the simple interest in the appropriate input box and experiment with princioal amount unti (II) matches to the nearest cent.