Home /
Expert Answers /
Civil Engineering /
the-below-activity-cycle-diagram-acd-depicts-the-operation-of-delivering-and-installing-precast-pa607
(Solved): The below Activity Cycle Diagram (ACD) depicts the operation of delivering and installing precast ...
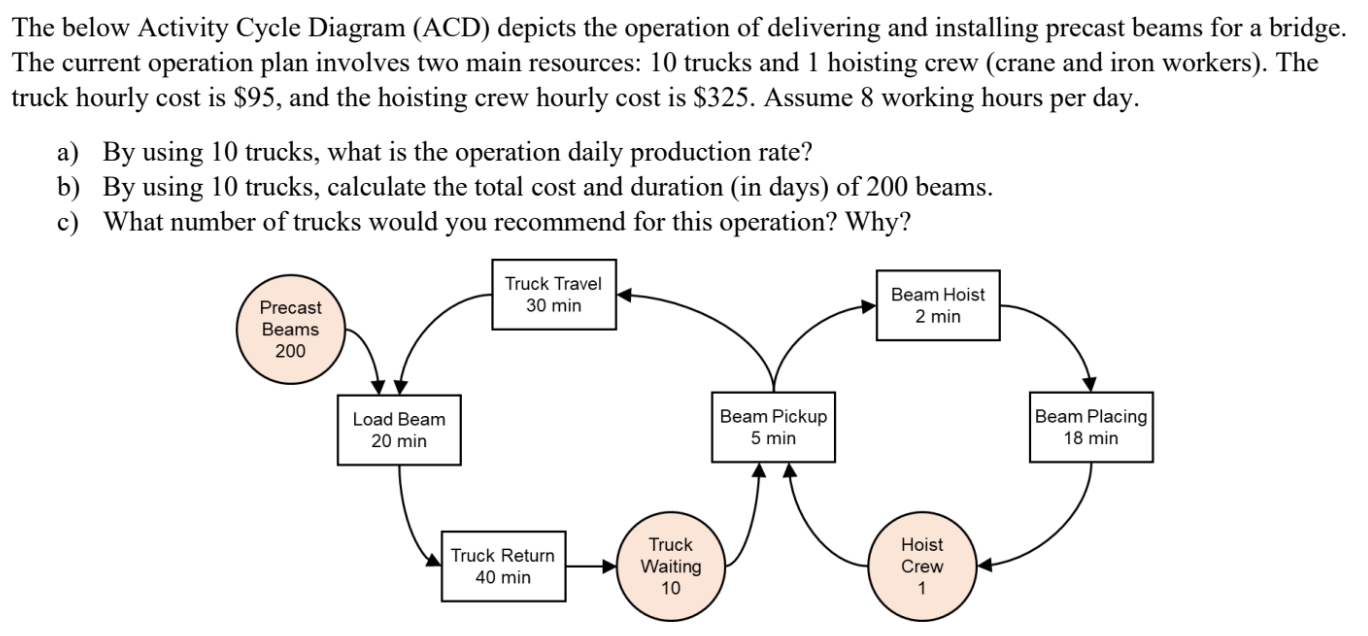
The below Activity Cycle Diagram (ACD) depicts the operation of delivering and installing precast beams for a bridge. The current operation plan involves two main resources: 10 trucks and 1 hoisting crew (crane and iron workers). The truck hourly cost is $95, and the hoisting crew hourly cost is $325. Assume 8 working hours per day. a) By using 10 trucks, what is the operation daily production rate? b) By using 10 trucks, calculate the total cost and duration (in days) of 200 beams. c) What number of trucks would you recommend for this operation? Why? Truck Travel 30 min Beam Hoist 2 min Precast Beams 200 Load Beam Beam Pickup Beam Placing 5 min 18 min 20 min Truck Return 40 min Truck Waiting 10 Hoist Crew 1
Expert Answer
a) daily operation cost: =325×95 =11,375 d