Home /
Expert Answers /
Statistics and Probability /
the-below-graph-represent-data-analysis-conducted-to-determine-any-correlation-between-the-selling-pa148
(Solved): The below graph represent data analysis conducted to determine any correlation between the selling ...
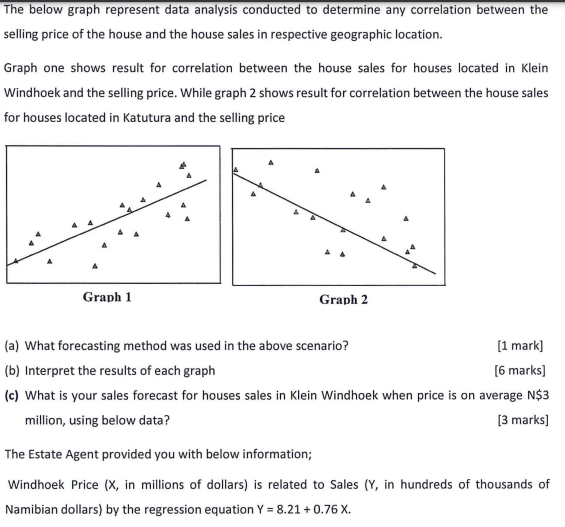
The below graph represent data analysis conducted to determine any correlation between the selling price of the house and the house sales in respective geographic location. Graph one shows result for correlation between the house sales for houses located in Klein Windhoek and the selling price. While graph 2 shows result for correlation between the house sales for houses located in Katutura and the selling price Grapn 1 Graph 2 (a) What forecasting method was used in the above scenario? [1 mark] (b) Interpret the results of each graph [6 marks] (c) What is your sales forecast for houses sales in Klein Windhoek when price is on average million, using below data? [3 marks] The Estate Agent provided you with below information; Windhoek Price ( , in millions of dollars) is related to Sales ( , in hundreds of thousands of Namibian dollars) by the regression equation .
Expert Answer
a) The forecasting method used in the scenario is the Linear Regression.b) Graph 1: The interpretation of Graph 1:The relationship between the house