Home /
Expert Answers /
Statistics and Probability /
the-box-plot-shown-below-was-constructed-for-the-amount-of-soda-that-was-poured-by-a-filling-machin-pa611
(Solved): The box plot shown below was constructed for the amount of soda that was poured by a filling machin ...
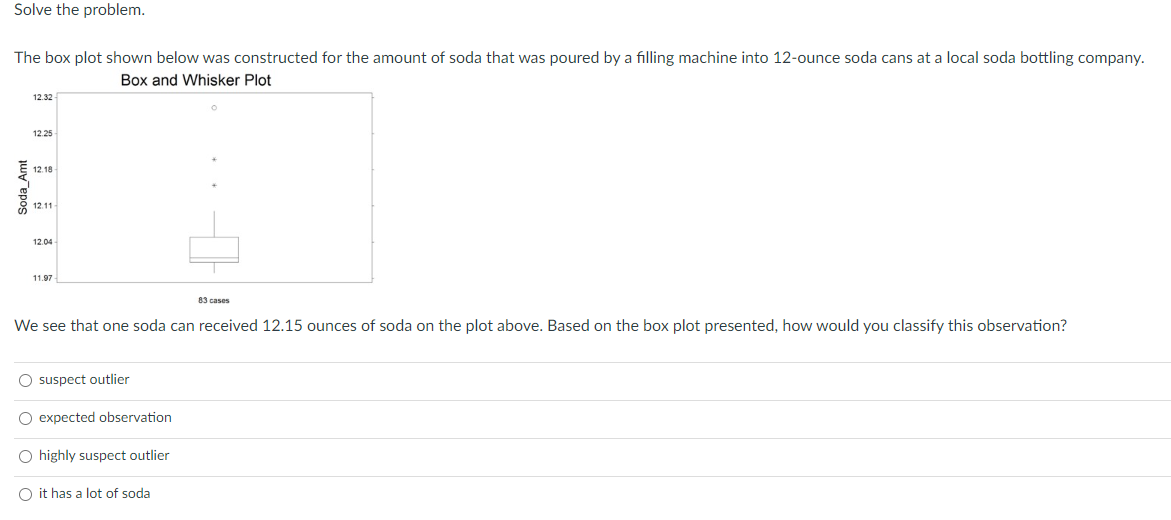
The box plot shown below was constructed for the amount of soda that was poured by a filling machine into 12-ounce soda cans at a local soda bottling company. ou cases We see that one soda can received 12.15 ounces of soda on the plot above. Based on the box plot presented, how would you classify this observation? suspect outlier expected observation highly suspect outlier it has a lot of soda