Home /
Expert Answers /
Statistics and Probability /
the-boxplot-summarizes-the-distribution-of-stock-prices-in-the-president-39-s-investment-account-ans-pa487
(Solved): The boxplot summarizes the distribution of stock prices in the president's investment account. Ans ...
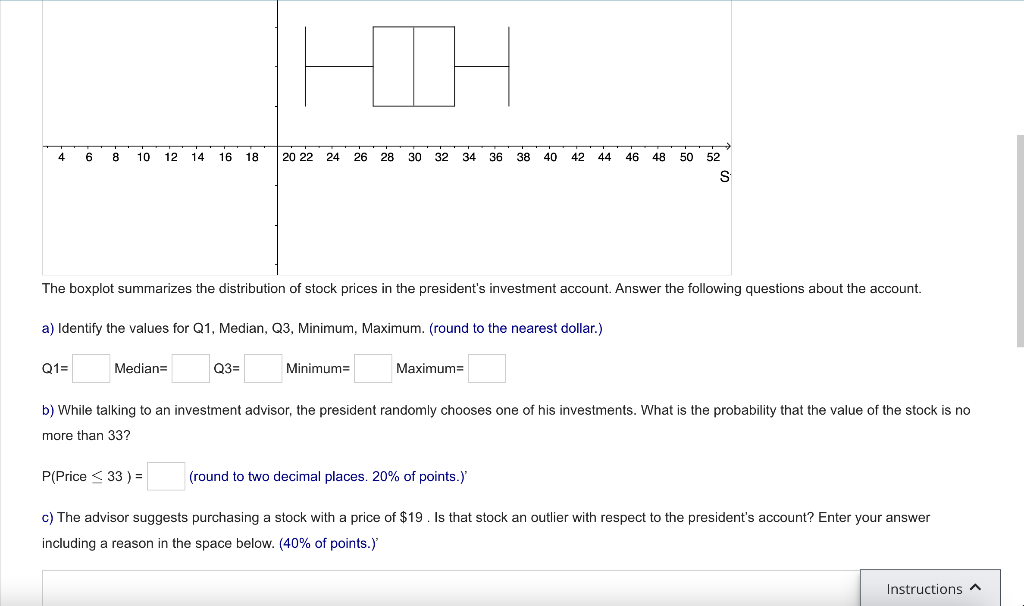
The boxplot summarizes the distribution of stock prices in the president's investment account. Answer the following questions about the account. a) Identify the values for Q1, Median, Q3, Minimum, Maximum. (round to the nearest dollar.) Q1= Median= Minimum Maximum b) While talking to an investment advisor, the president randomly chooses one of his investments. What is the probability that the value of the stock is no more than Price (round to two decimal places. of points.)' c) The advisor suggests purchasing a stock with a price of . Is that stock an outlier with respect to the president's account? Enter your answer including a reason in the space below. (40\% of points.)'
Expert Answer
from the given box plot a) Q1=27,median=30,Q3=33Minimum=22and Maximum=37