Home /
Expert Answers /
Statistics and Probability /
the-contingency-table-shown-to-the-right-gives-a-cross-classification-of-a-random-sample-of-values-pa963
(Solved): The contingency table shown to the right gives a cross-classification of a random sample of values ...
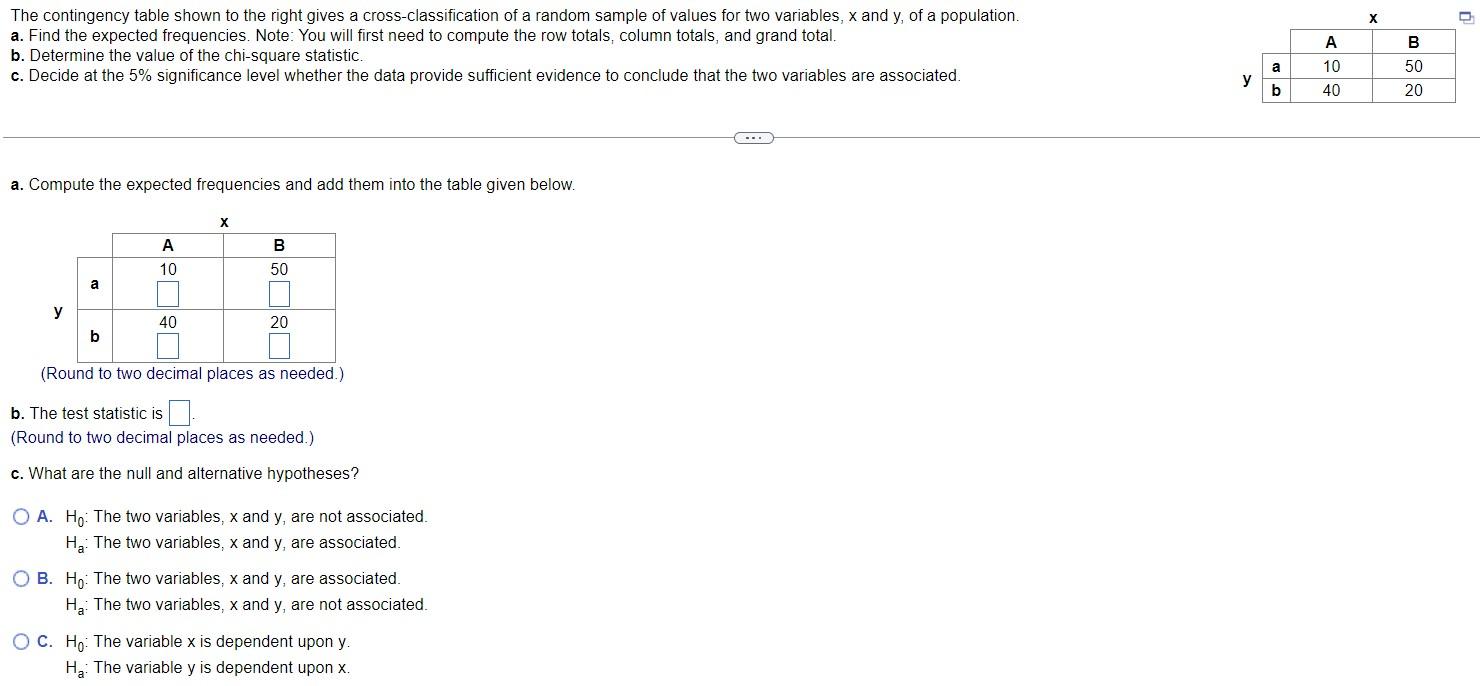
The contingency table shown to the right gives a cross-classification of a random sample of values for two variables, \( x \) and \( y \), of a population. a. Find the expected frequencies. Note: You will first need to compute the row totals, column totals, and grand total. b. Determine the value of the chi-square statistic. c. Decide at the \( 5 \% \) significance level whether the data provide sufficient evidence to conclude that the two variables are associated. a. Compute the expected frequencies and add them into the table given below. (Round to two decimal places as needed.) b. The test statistic is (Round to two decimal places as needed.) c. What are the null and alternative hypotheses? A. \( \mathrm{H}_{0} \) : The two variables, \( x \) and \( y \), are not associated. \( \mathrm{H}_{\mathrm{a}} \) : The two variables, \( x \) and \( y \), are associated. B. \( \mathrm{H}_{0} \) : The two variables, \( x \) and \( y \), are associated. \( \mathrm{H}_{\mathrm{a}} \) : The two variables, \( \mathrm{x} \) and \( \mathrm{y} \), are not associated. C. \( \mathrm{H}_{0} \) : The variable \( \mathrm{x} \) is dependent upon \( \mathrm{y} \). \( \mathrm{H}_{\mathrm{a}}: \) The variable \( \mathrm{y} \) is dependent upon \( \mathrm{x} \).
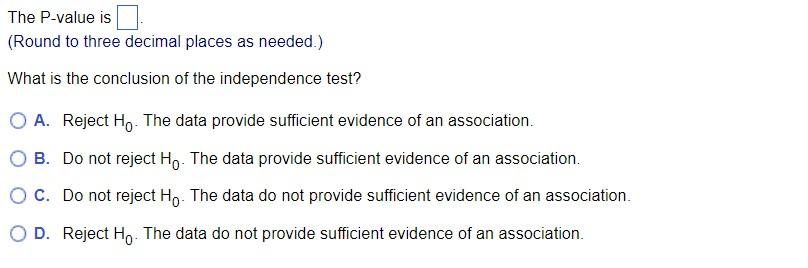
The P-value is (Round to three decimal places as needed.) What is the conclusion of the independence test? A. Reject \( \mathrm{H}_{0} \). The data provide sufficient evidence of an association. B. Do not reject \( \mathrm{H}_{0} \). The data provide sufficient evidence of an association. C. Do not reject \( \mathrm{H}_{0} \). The data do not provide sufficient evidence of an associe D. Reject \( \mathrm{H}_{0} \). The data do not provide sufficient evidence of an association.
Expert Answer
Observed frequencies are given by - A B