Home /
Expert Answers /
Statistics and Probability /
the-data-in-the-relative-frequency-bar-graph-below-represents-the-number-of-stars-earned-by-140-pe-pa233
(Solved): The data in the relative frequency bar graph below represents the number of stars earned by 140 pe ...
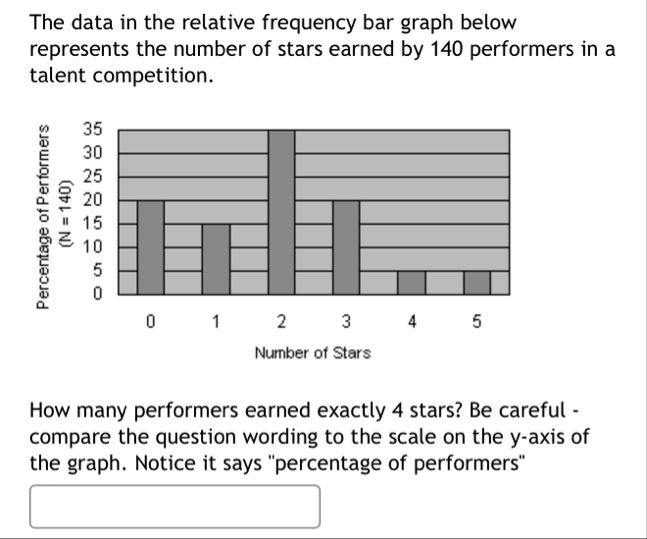
The data in the relative frequency bar graph below represents the number of stars earned by 140 performers in a talent competition. How many performers earned exactly 4 stars? Be careful compare the question wording to the scale on the
y-axis of the graph. Notice it says "percentage of performers"