Home /
Expert Answers /
Advanced Math /
the-figure-below-shows-a-network-of-water-pipes-with-flows-measured-in-liters-per-minute-the-figur-pa203
(Solved): The figure below shows a network of water pipes with flows measured in liters per minute. The figur ...
The figure below shows a network of water pipes with flows measured in liters per minute.
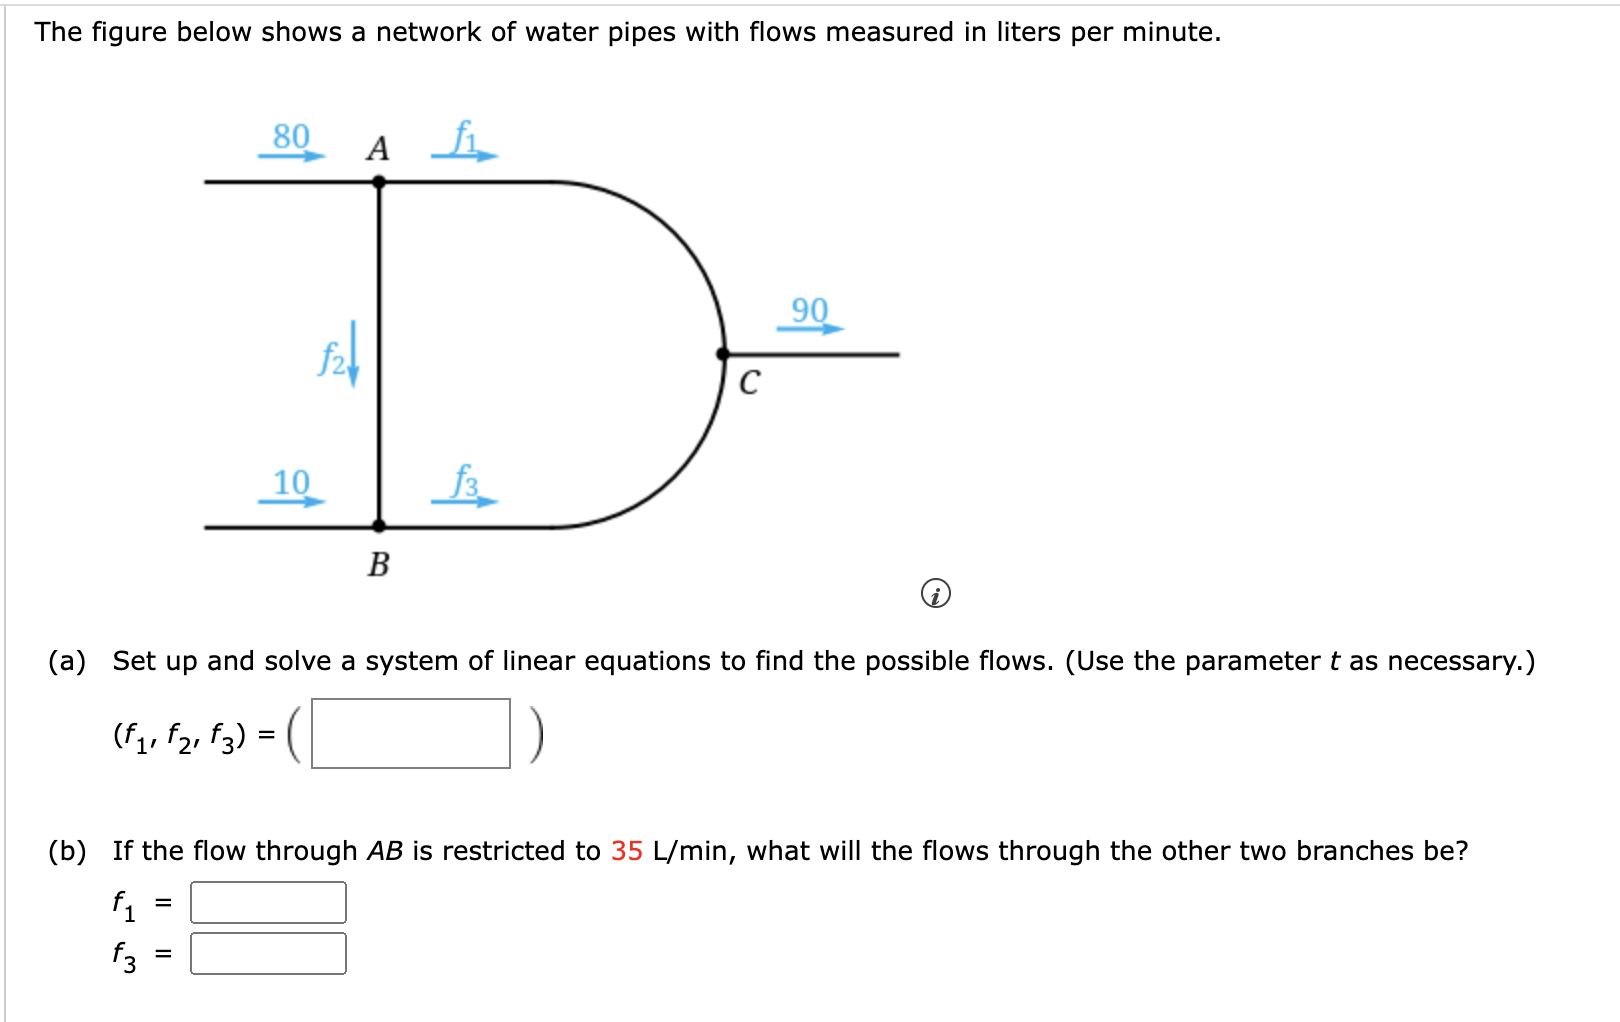
The figure below shows a network of water pipes with flows measured in liters per minute. (a) Set up and solve a system of linear equations to find the possible flows. (Use the parameter as necessary.) (b) If the flow through is restricted to , what will the flows through the other two branches be?
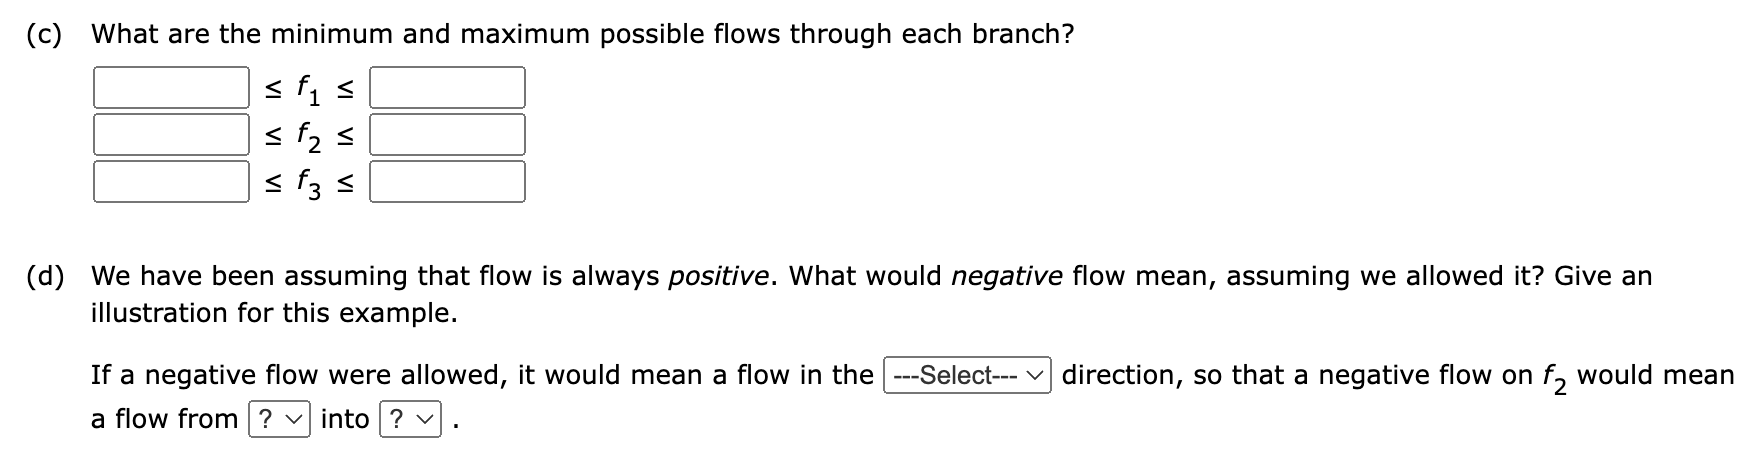
(c) What are the minimum and maximum possible flows through each branch? (d) We have been assuming that flow is always positive. What would negative flow mean, assuming we allowed it? Give an illustration for this example. If a negative flow were allowed, it would mean a flow in the direction, so that a negative flow on would mean a flow from into