Home /
Expert Answers /
Algebra /
the-figure-on-the-right-shows-the-graphs-of-the-cost-and-revenue-functions-for-a-company-that-manufa-pa428
(Solved): The figure on the right shows the graphs of the cost and revenue functions for a company that manufa ...
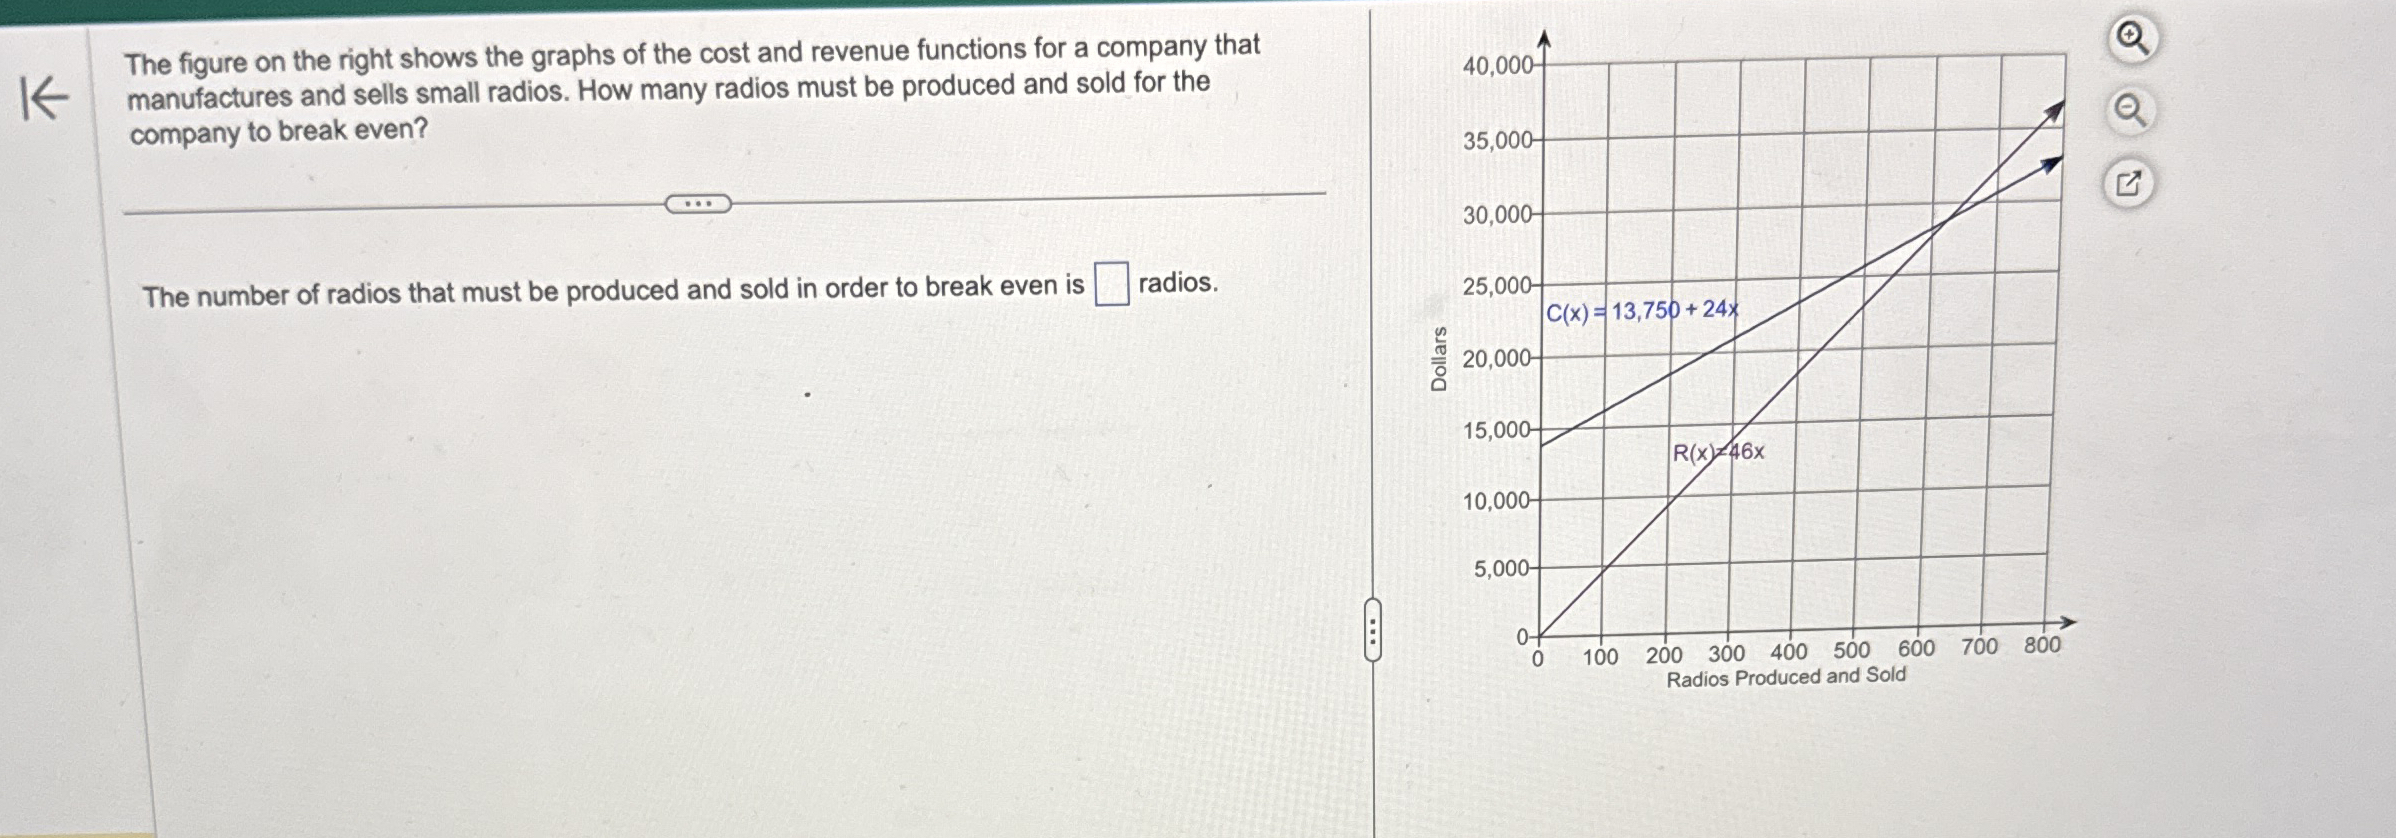
The figure on the right shows the graphs of the cost and revenue functions for a company that manufactures and sells small radios. How many radios must be produced and sold for the company to break even? The number of radios that must be produced and sold in order to break even is radios.