Home /
Expert Answers /
Statistics and Probability /
the-following-contingency-table-gives-the-results-of-a-sample-survey-of-sowetan-male-and-female-resp-pa398
(Solved): The following contingency table gives the results of a sample survey of Sowetan male and female resp ...
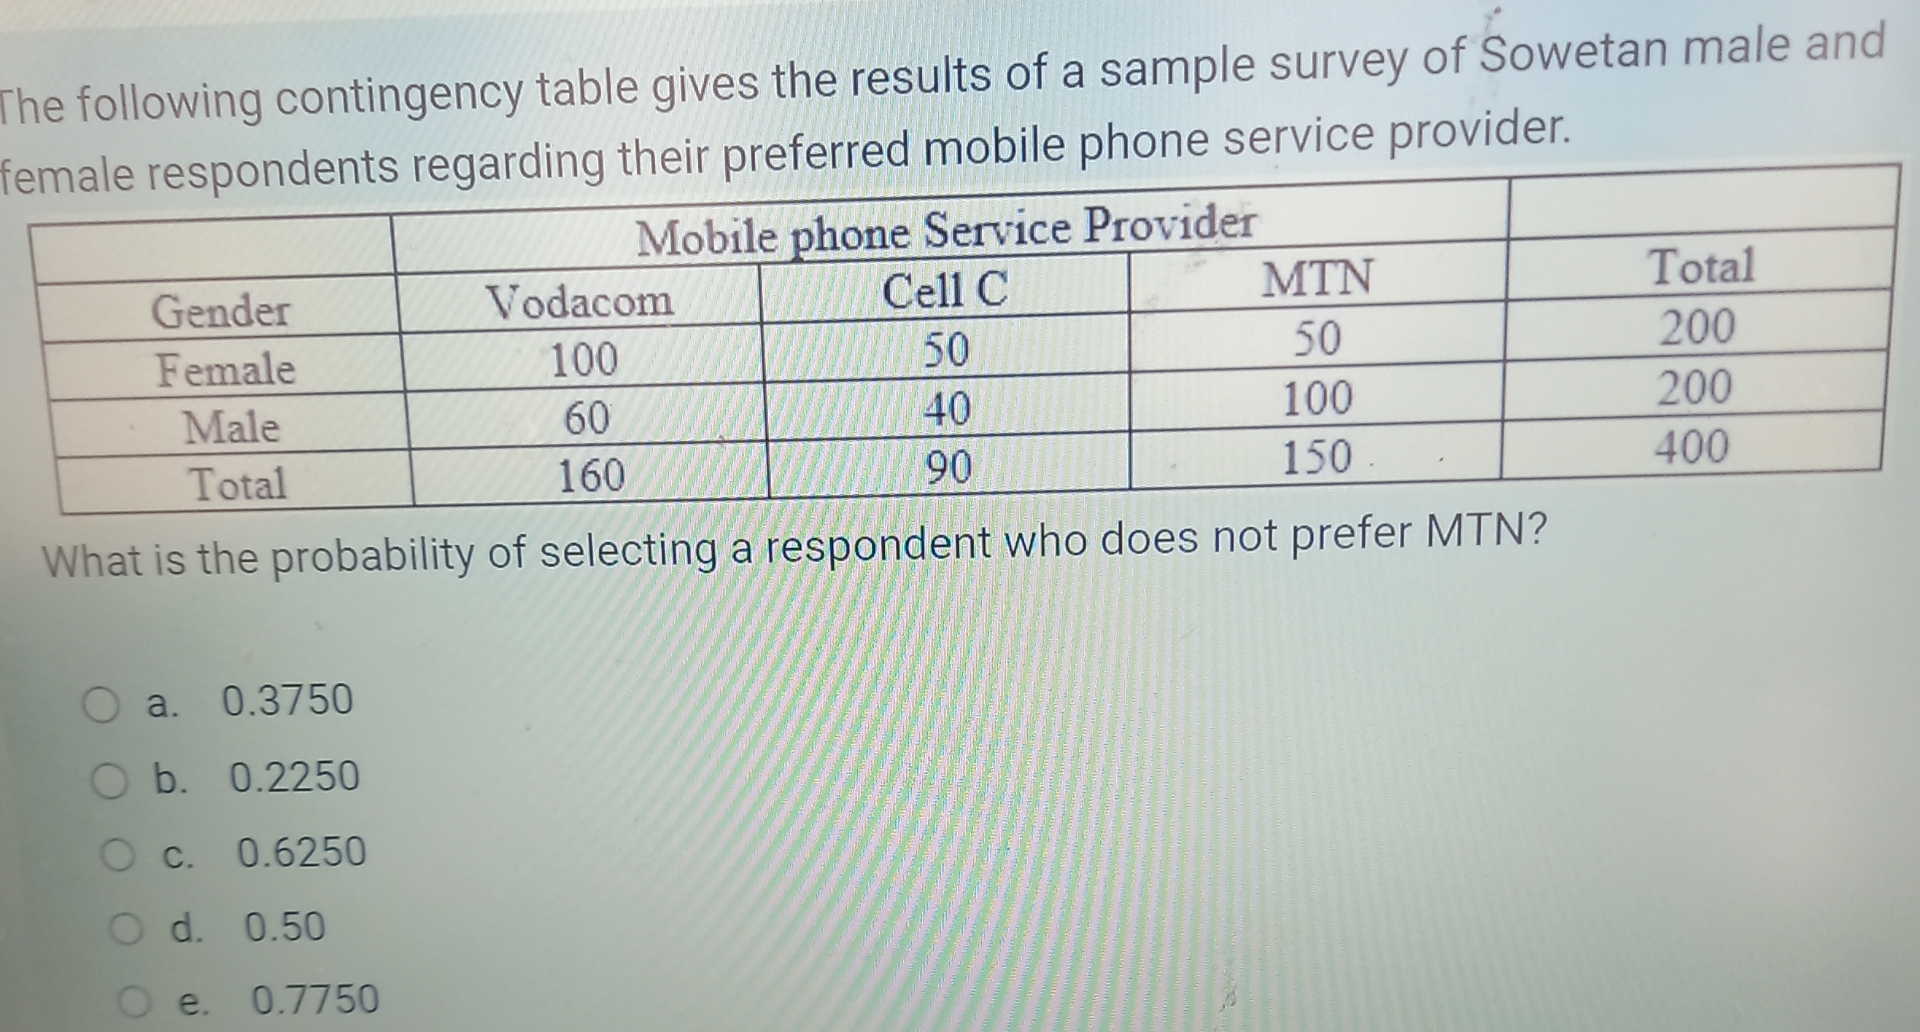
The following contingency table gives the results of a sample survey of Sowetan male and female respondents regarding their preferred mobile phone service provider. \table[[,Mobile phone Service Provider,],[Gender,Vodacom,Cell C,MTN,Total],[Female,100,50,50,200],[Male,60,40,100,200],[Total,160,90,150,400]] What is the probability of selecting a respondent who does not prefer MTN? a. 0.3750 b. 0.2250 c. 0.6250 d. 0.50 e. 0.7750