Home /
Expert Answers /
Statistics and Probability /
the-following-data-represent-the-high-temperature-distribution-for-a-summer-month-in-a-city-for-som-pa827
(Solved): The following data represent the high-temperature distribution for a summer month in a city for som ...
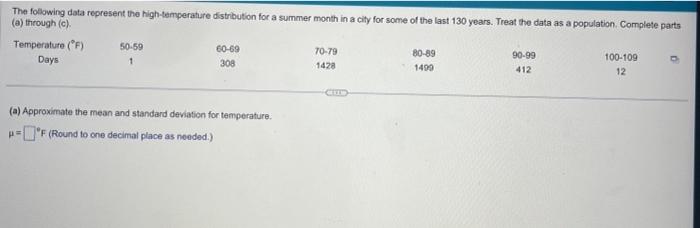
The following data represent the high-temperature distribution for a summer month in a city for some of the last 130 years. Treat the data as a population. Complete parts (a) through (c). \begin{tabular}{cccccc} Temperature ( \( \left.{ }^{\circ} \mathrm{F}\right) \) & \( 50-59 \) & \( 60-69 \) & \( 70-79 \) & \( 80-89 \) \\ Days & 1 & 308 & 1428 & 1400 \\ & & & & 12 \\ \hline \end{tabular} (a) Approximate the mean and standard deviation for temperature. \( \mu=\quad F \) (Round to one decimal place as needed.)