Home /
Expert Answers /
Economics /
the-following-graph-depicts-the-short-run-and-long-run-phillips-curves-srpc-and-lrpc-for-a-hypoth-pa553
(Solved): The following graph depicts the short-run and long-run Phillips curves (SRPC and LRPC) for a hypoth ...
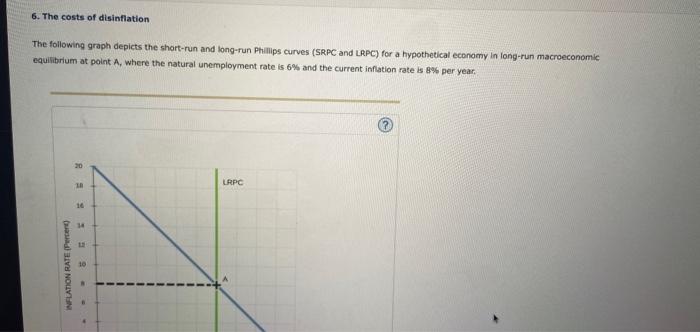
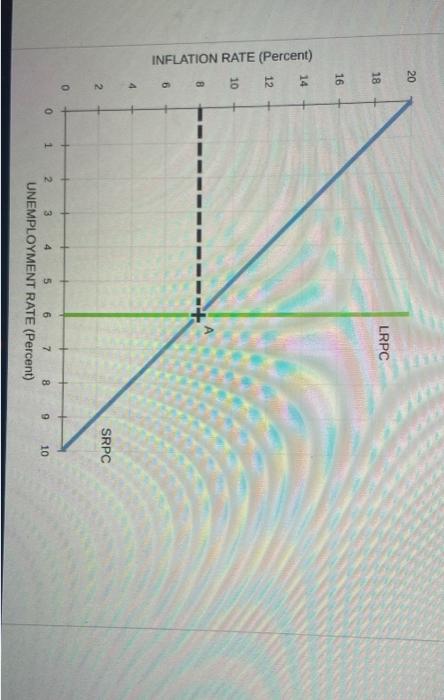
The following graph depicts the short-run and long-run Phillips curves (SRPC and LRPC) for a hypothetical economy In long-run macroeconomic equibitium at point A, where the natural unemployment rate is \( 6 \% \) and the current inflation rate is go. per year.
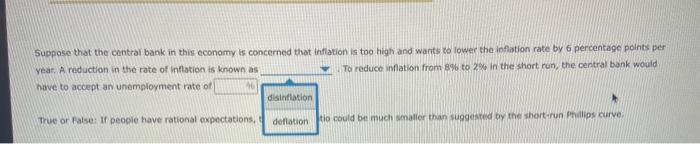
Suppose that the central bank in this economy is concerned that inflation is too high and wants to iower the inflistion rate by 6 percentage polnts per Year, A reduction in the rate of Inflation is known as To reduce inflation from 896 to 20 in the short run, the central bank would nave to accept an unemployment rate of True or false: if people have rational expectations, tio could be wuch smaller than suggested by the short-run phallips curve.
True or False: If people have rational expectations, the sacrifice ratio could be much smaller than suggested by the short-run Philips curve. True Folset
Expert Answer
Answer: disinflation, 9% The central bank assumes that inflation in this economy is too high and wants to reduce the