Home /
Expert Answers /
Economics /
the-following-graph-plots-aggregate-demand-ad202-and-aggregate-supply-as-for-the-imaginar-pa781
(Solved): The following graph plots aggregate demand (AD202 ) and aggregate supply (AS) for the imaginar ...
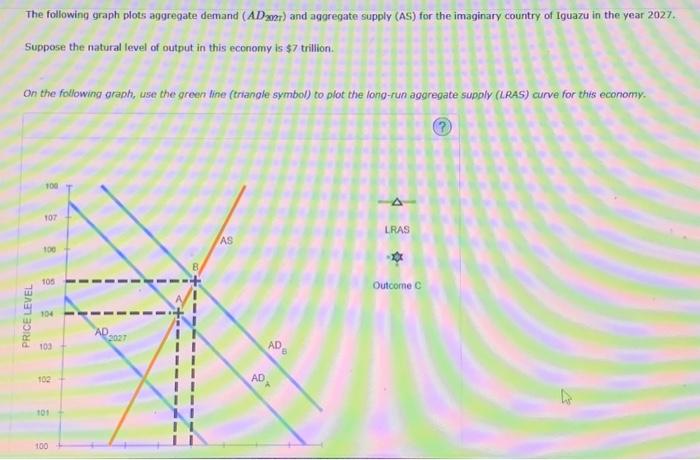

The following graph plots aggregate demand ) and aggregate supply (AS) for the imaginary country of Iguazu in the year 2027. Suppose the natural level of output in this economy is trillion. On the following graph, use the green line (triangle symbol) to plot the long-run aggregate supply (L.RAS) curve for this economy.
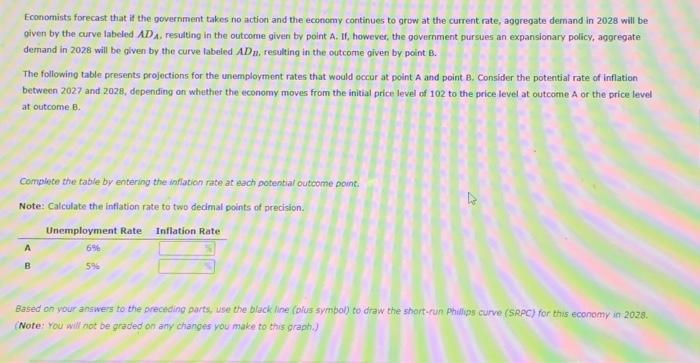
Economists forecast that it the government takes no action and the economy continues to grow at the current rate, agoregate demand in 2028 will be given by the curve inbeled , resulting in the outcome given by point A. If, however, the government pursues an expanslonary policy, agoregate dernand in 2028 will be given by the curve labeled , resulting in the outcome given by point . The following table presents projections for the unemployment rates that would occur at point A and point B. Consider the potential rate of inflation between 2027 and 2028, depending on whether the economy moves from the initial price level of 102 to the price level at outcome A or the price level at outcome 8 . Complece the table by entering the inflation rate at each potential outcome point: Note: Calculate the inflation rate to two declmal points of precision. Based on your answers to the precteding parts, use the black line (olus sympol) to draw the short-run Phillips curve (SRPC) for this economy in 2028. (Note: You will not be graded on any changes vou make to this graph.)
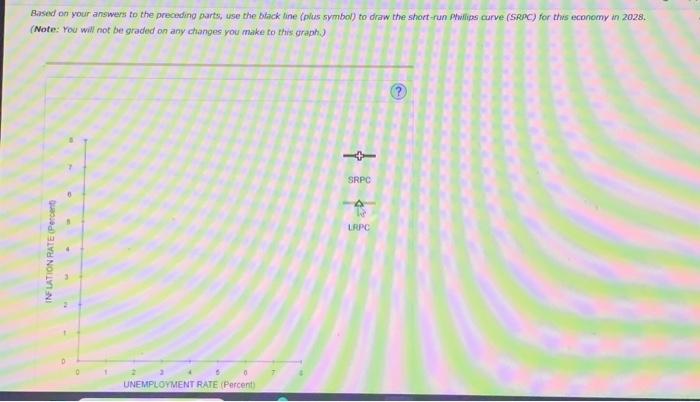
Based on your answers to the preceding parts, use the black line (plus symbol) to draw the short-run Phwilips curve (SRPC) for this economy in 2028 . (Note: You will not be graded on any changes you make to this graph.)
The short-run Phillips curve is line:
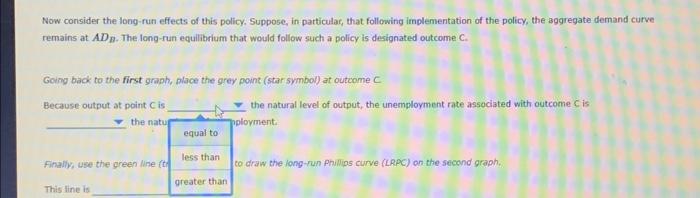
Now consider the long-run effects of this policy. Suppose, in particular, that following implementation of the policy, the aggregate demand curve remains at . The long-run equilibrium that would follow such a policy is designated outcome . Going back to the first graph, place the grey point (star symbol) at outcome
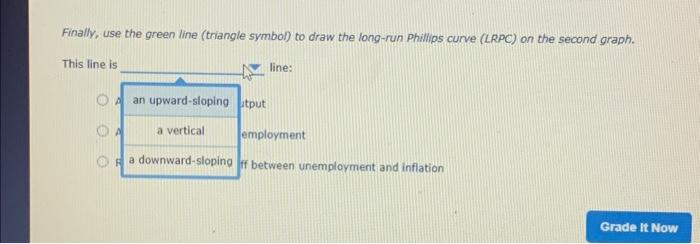
Finally, use the green line (triangle symbol) to draw the long-run Phillips curve (LRPC) on the second graph. This line is line: itput employment if between unemployment and inflation
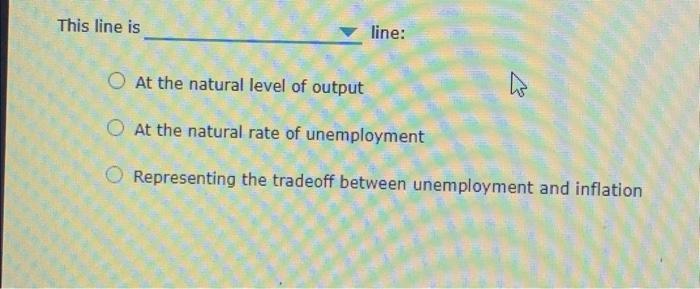
This line is line: At the natural level of output At the natural rate of unemployment Representing the tradeoff between unemployment and inflation