Home /
Expert Answers /
Calculus /
the-following-graphs-represent-the-velocity-v-of-a-particle-moving-along-the-x-axis-for-time-0-lt-pa222
(Solved): The following graphs represent the velocity, v, of a particle moving along the x-axis for time 0< ...
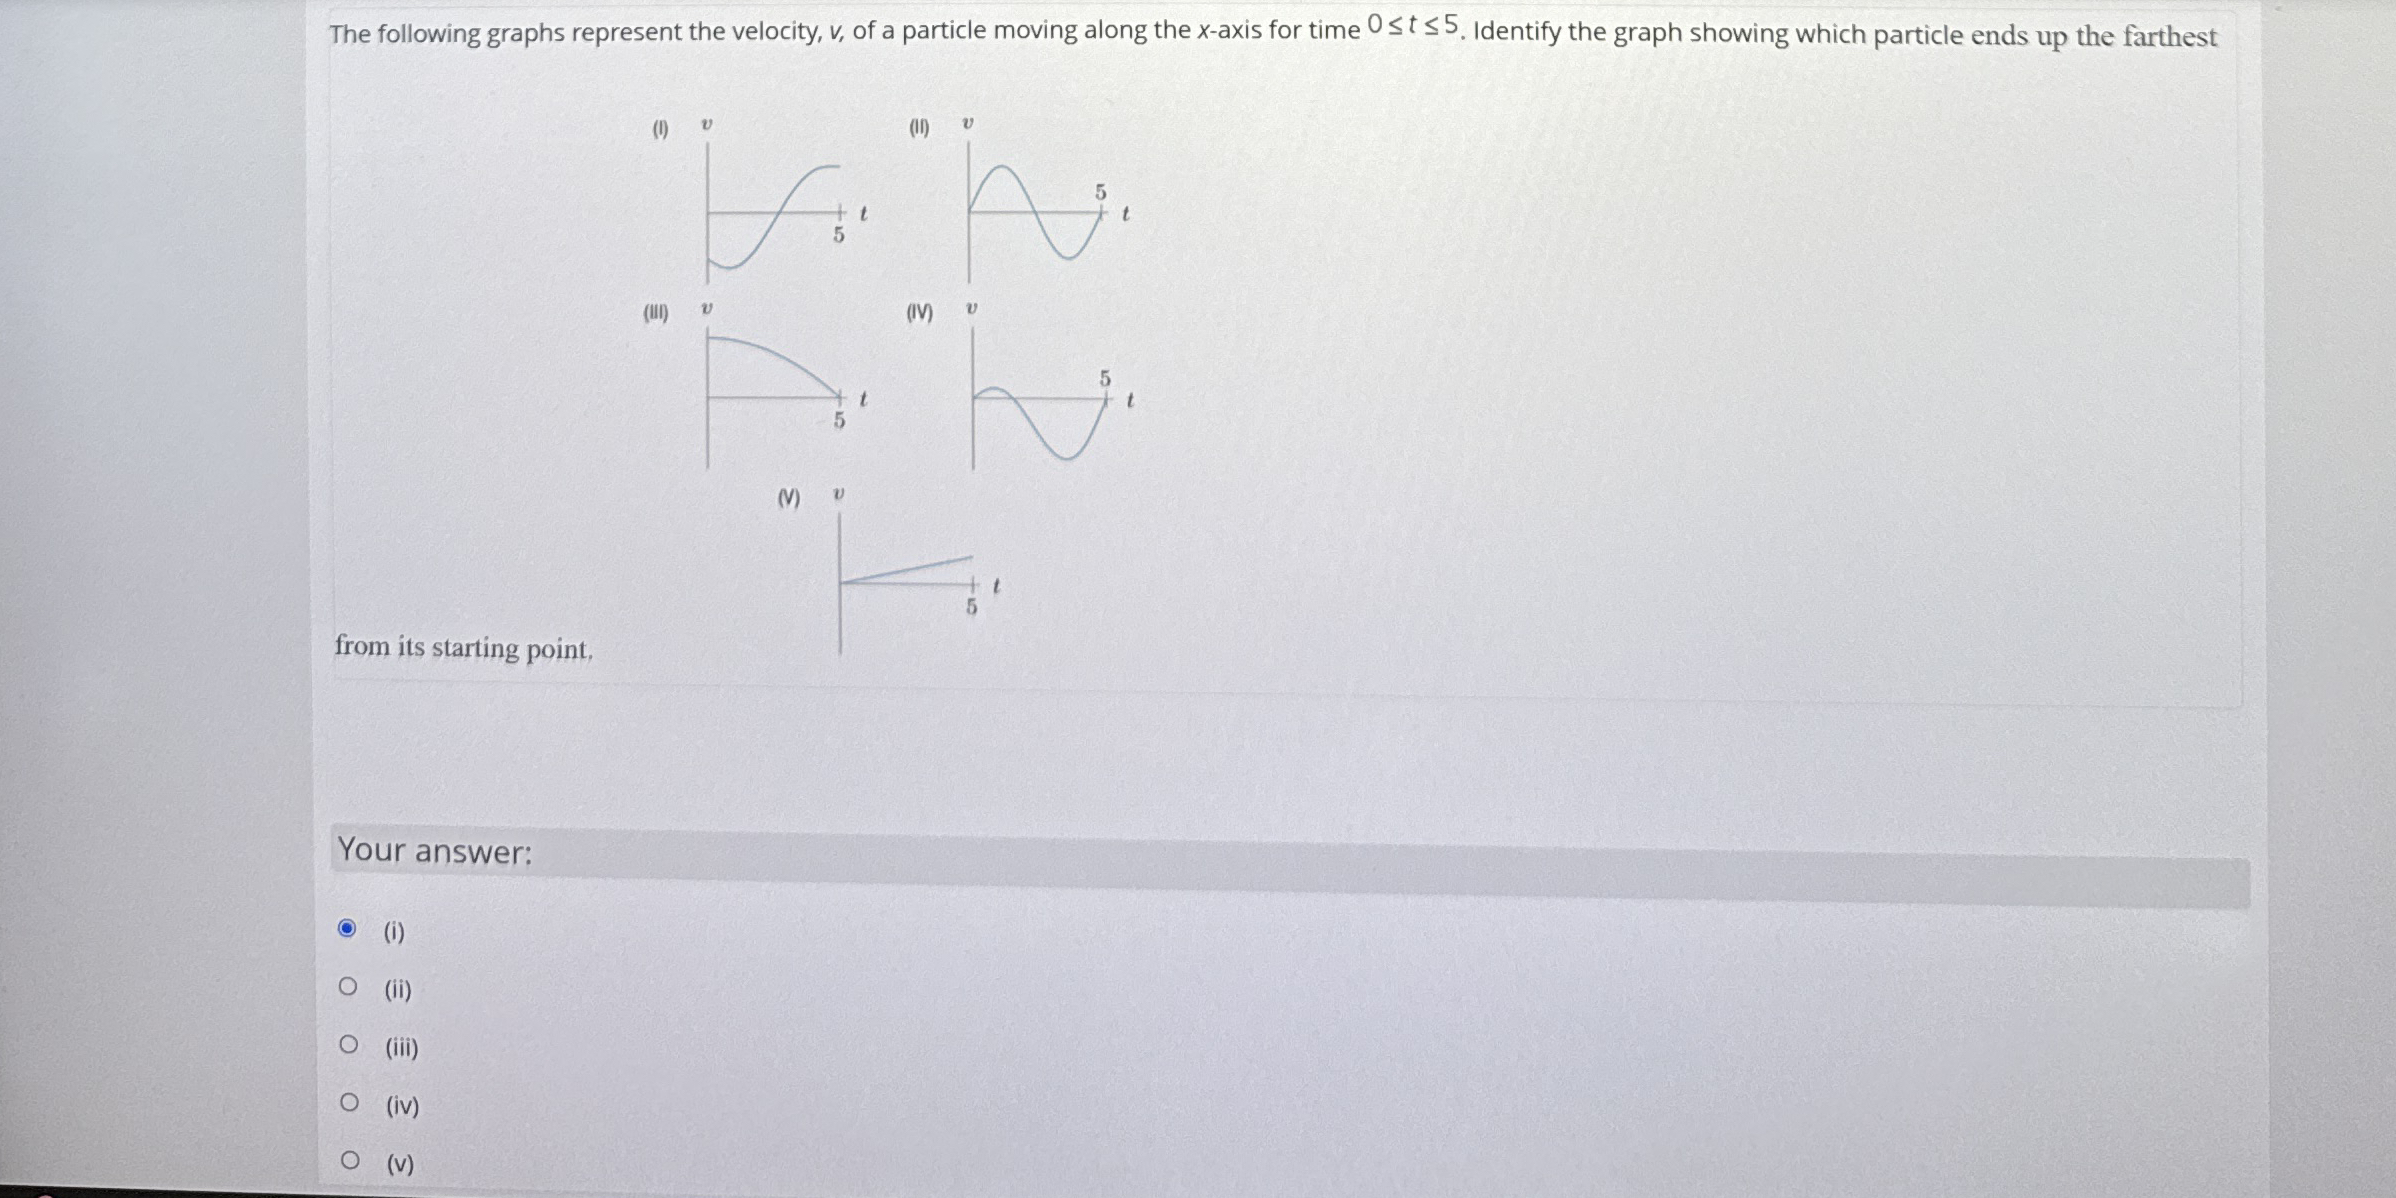
The following graphs represent the velocity,
v, of a particle moving along the
x-axis for time
0<=t<=5. Identify the graph showing which particle ends up the farthest from its starting point, Your answer: (i) (ii) (iii) (iv) (v)