Home /
Expert Answers /
Statistics and Probability /
the-following-joint-frequency-distribution-table-shows-responses-from-a-sample-of-225-unionized-empl-pa799
(Solved): The following joint frequency distribution table shows responses from a sample of 225 unionized empl ...
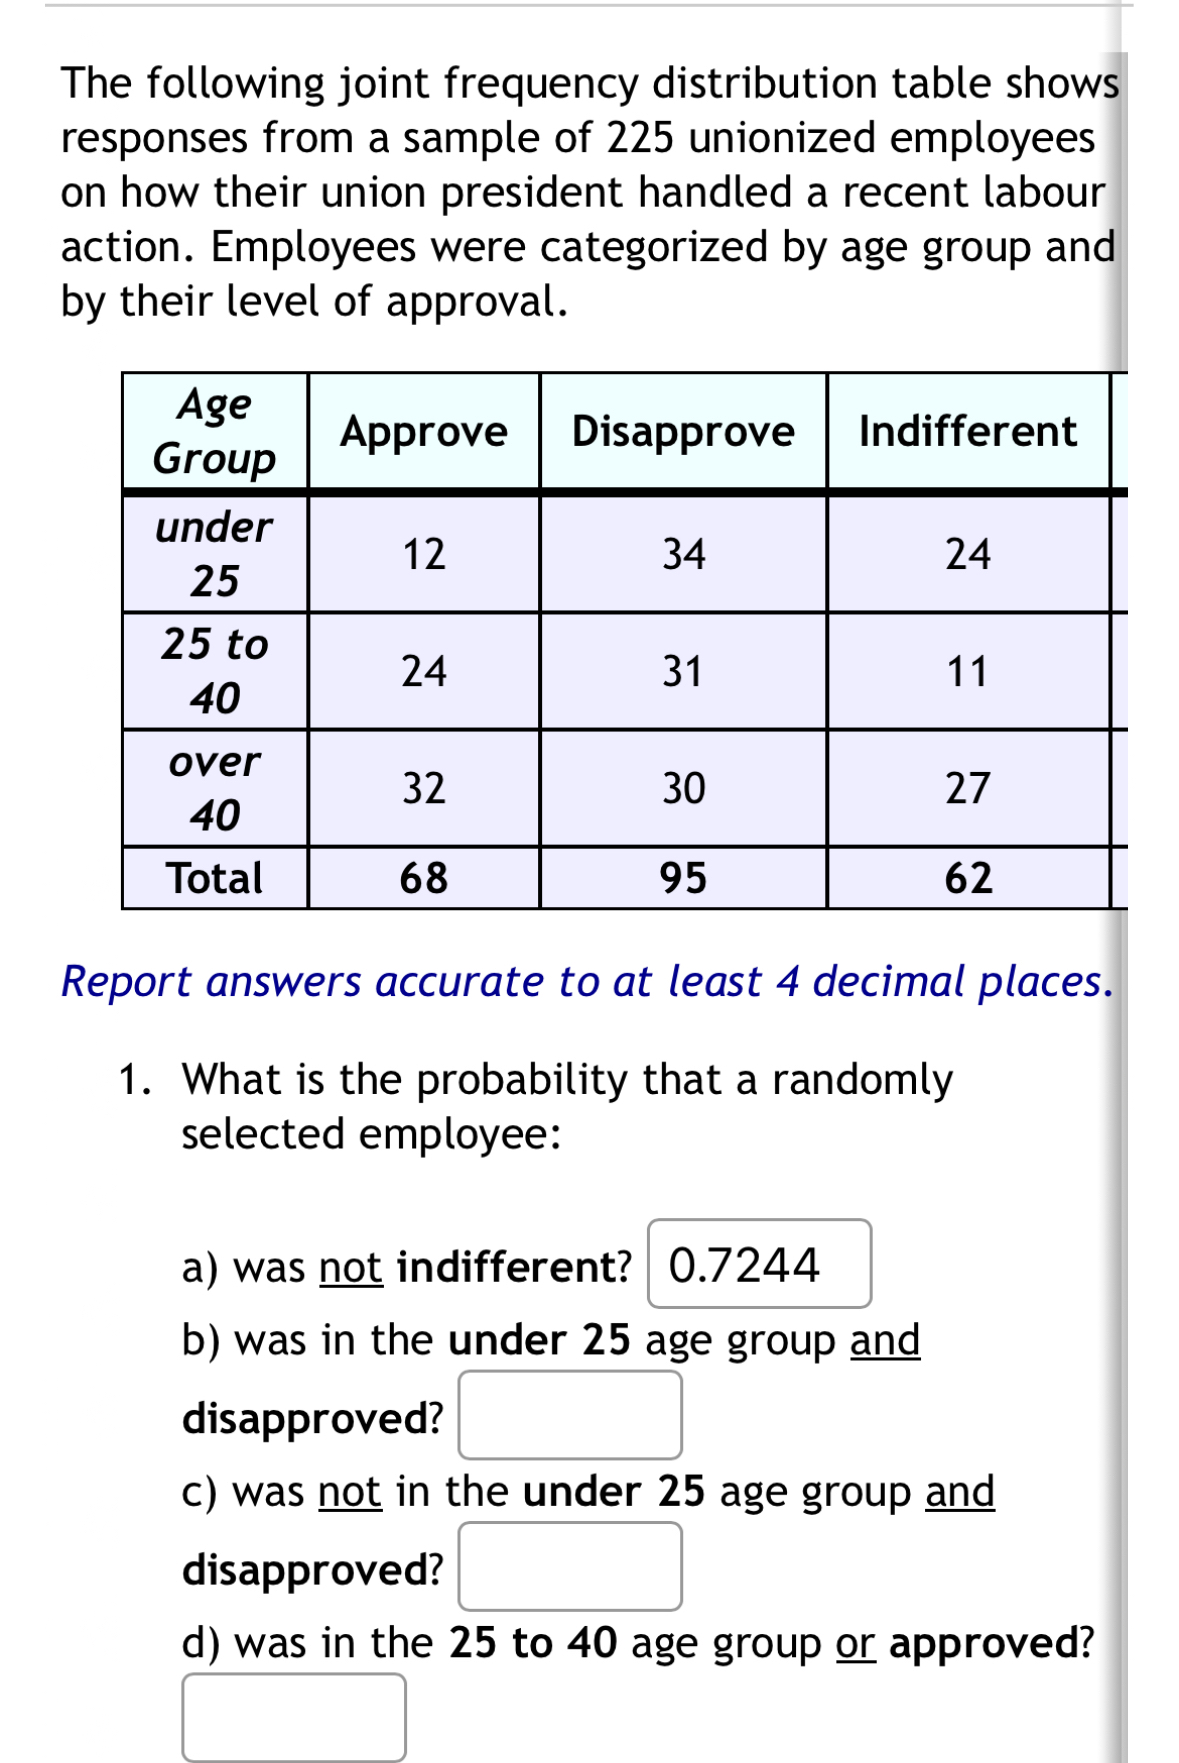
The following joint frequency distribution table shows responses from a sample of 225 unionized employees on how their union president handled a recent labour action. Employees were categorized by age group and by their level of approval. \table[[\table[[Age],[Group]],Approve,Disapprove,Indifferent],[\table[[under],[25]],12,34,24],[\table[[25 to],[40]],24,31,11],[\table[[over],[40]],32,30,27],[Total,68,95,62]] Report answers accurate to at least 4 decimal places. What is the probability that a randomly selected employee: a) was not indifferent? b) was in the under
25age group and disapproved? c) was not in the under
25age group and disapproved? d) was in the
25to
40age group or approved?