(Solved): The following reaction data has been obtained from a simple decay reaction: A->B Use MATLAB to pl ...
The following reaction data has been obtained from a simple decay reaction:
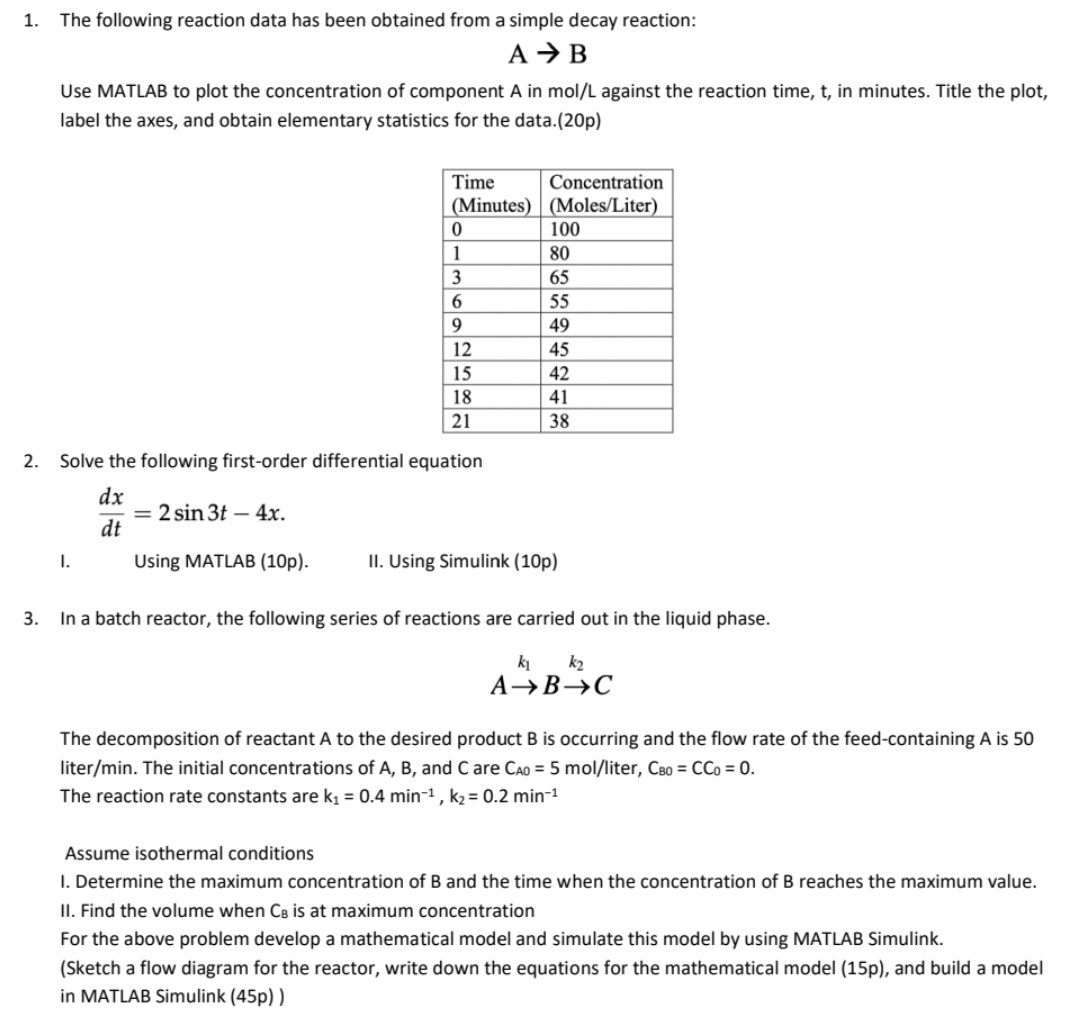
A->BUse MATLAB to plot the concentration of component A in mol/L against the reaction time,
t, in minutes. Title the plot, label the axes, and obtain elementary statistics for the data.(20p) \table[[\table[[Time],[(Minutes)]],\table[[Concentration],[(Moles/Liter)]]],[0,100],[1,80],[3,65],[6,55],[9,49],[12,45],[15,42],[18,41],[21,38]] Solve the following first-order differential equation
(dx)/(dt)=2sin3t-4xI. Using MATLAB (10p). II. Using Simulink (10p) 3. In a batch reactor, the following series of reactions are carried out in the liquid phase.
A->k_(1)B->k_(2)CThe decomposition of reactant
Ato the desired product
Bis occurring and the flow rate of the feed-containing
Ais 50 liter
/min. The initial concentrations of
A,B, and C are
C_(A0)=5mo(l)/(l)iter,C_(B0)=CC_(0)=0. The reaction rate constants are
k_(1)=0.4min^(-1),k_(2)=0.2min^(-1)Assume isothermal conditions I. Determine the maximum concentration of B and the time when the concentration of B reaches the maximum value. II. Find the volume when
C_(B)is at maximum concentration For the above problem develop a mathematical model and simulate this model by using MATLAB Simulink. (Sketch a flow diagram for the reactor, write down the equations for the mathematical model (15p), and build a model in MATLAB Simulink (45p) )