(Solved): The following scenario examines the relationship between marginal and average values. Suppose Mina i ...
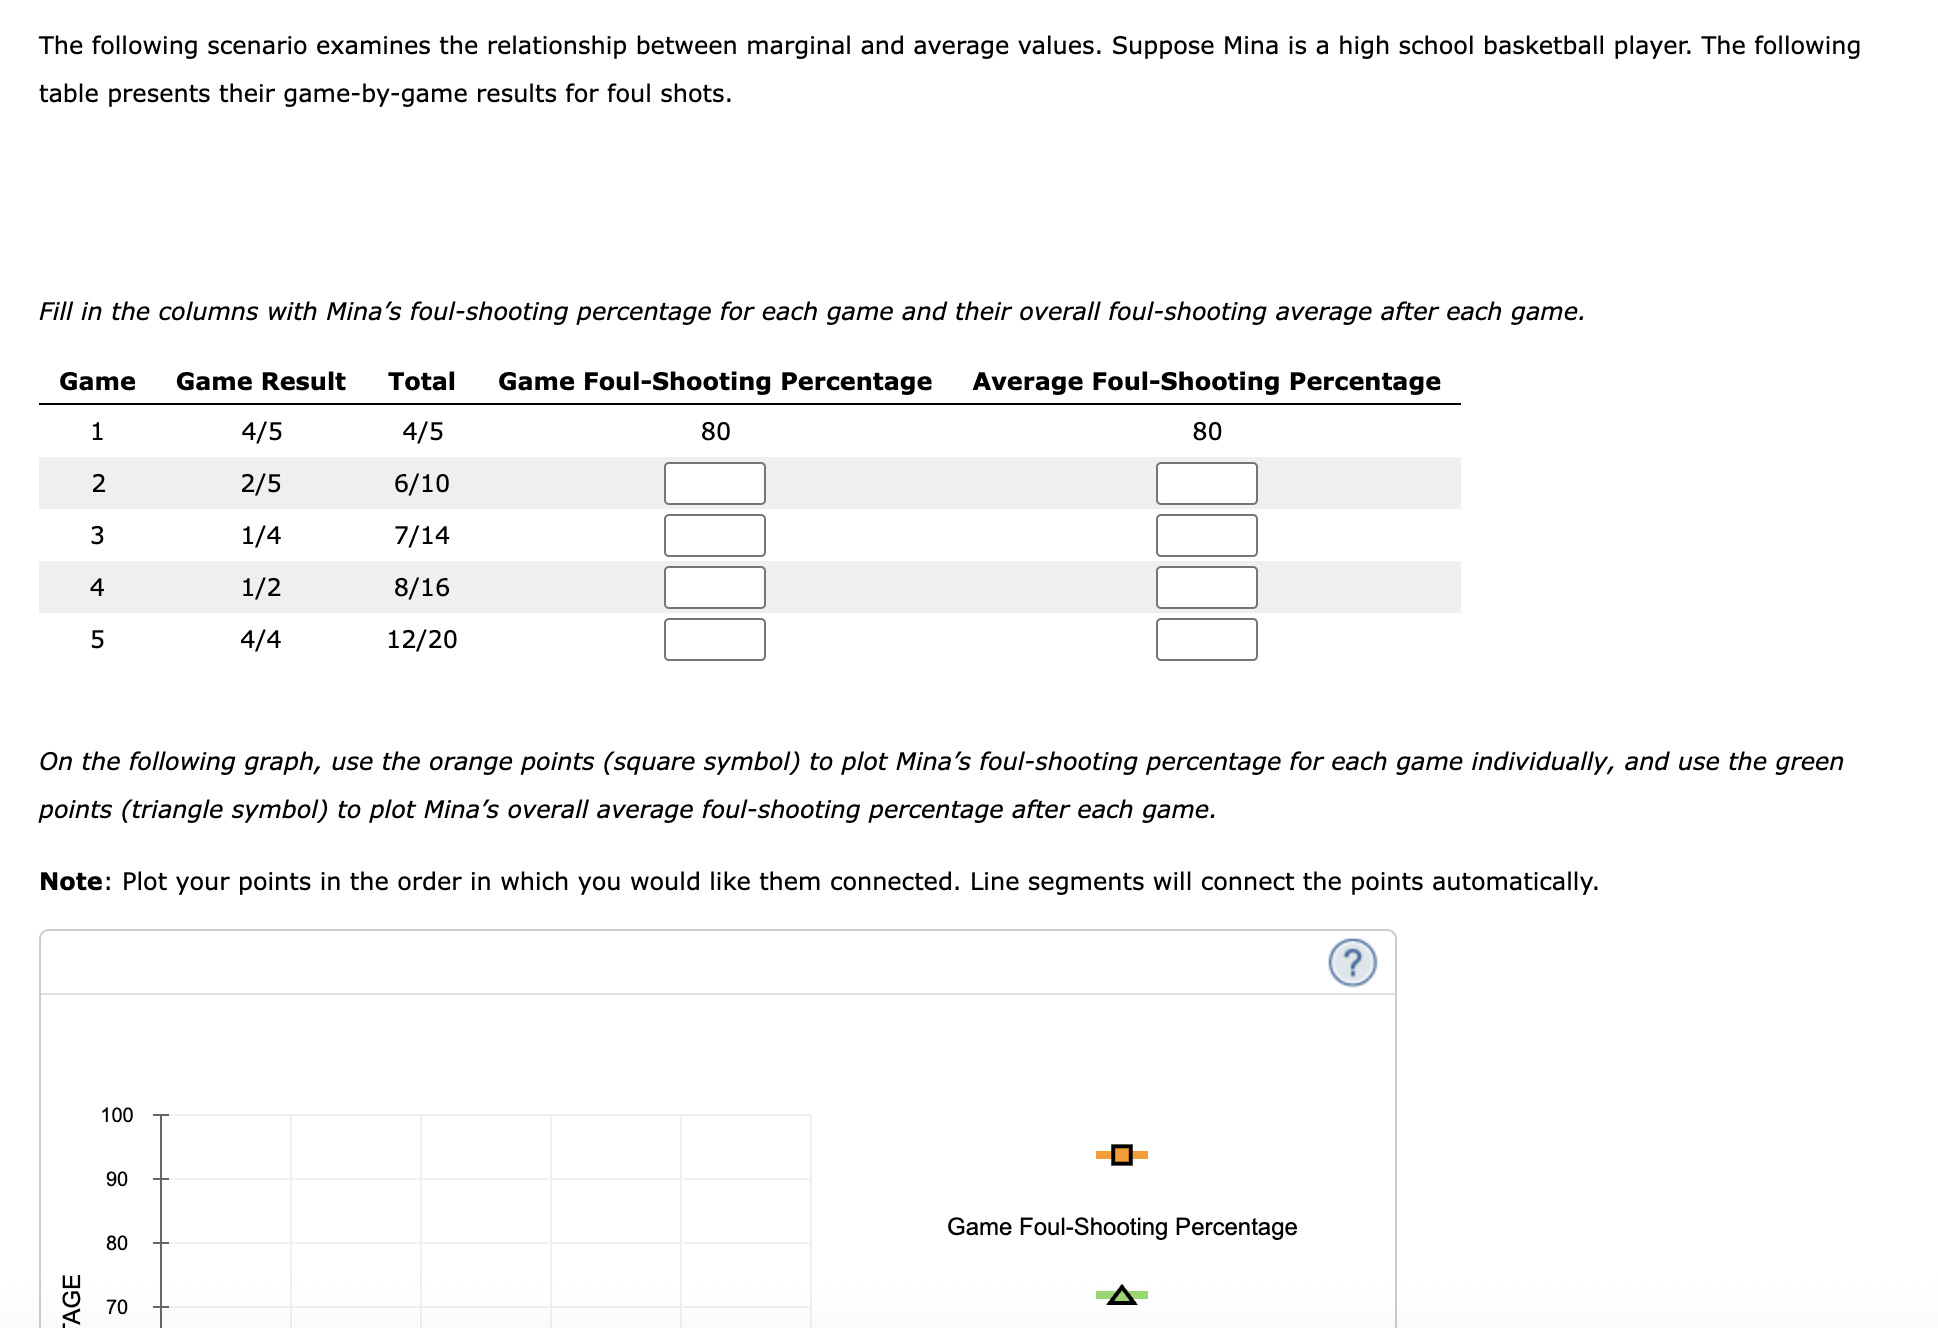
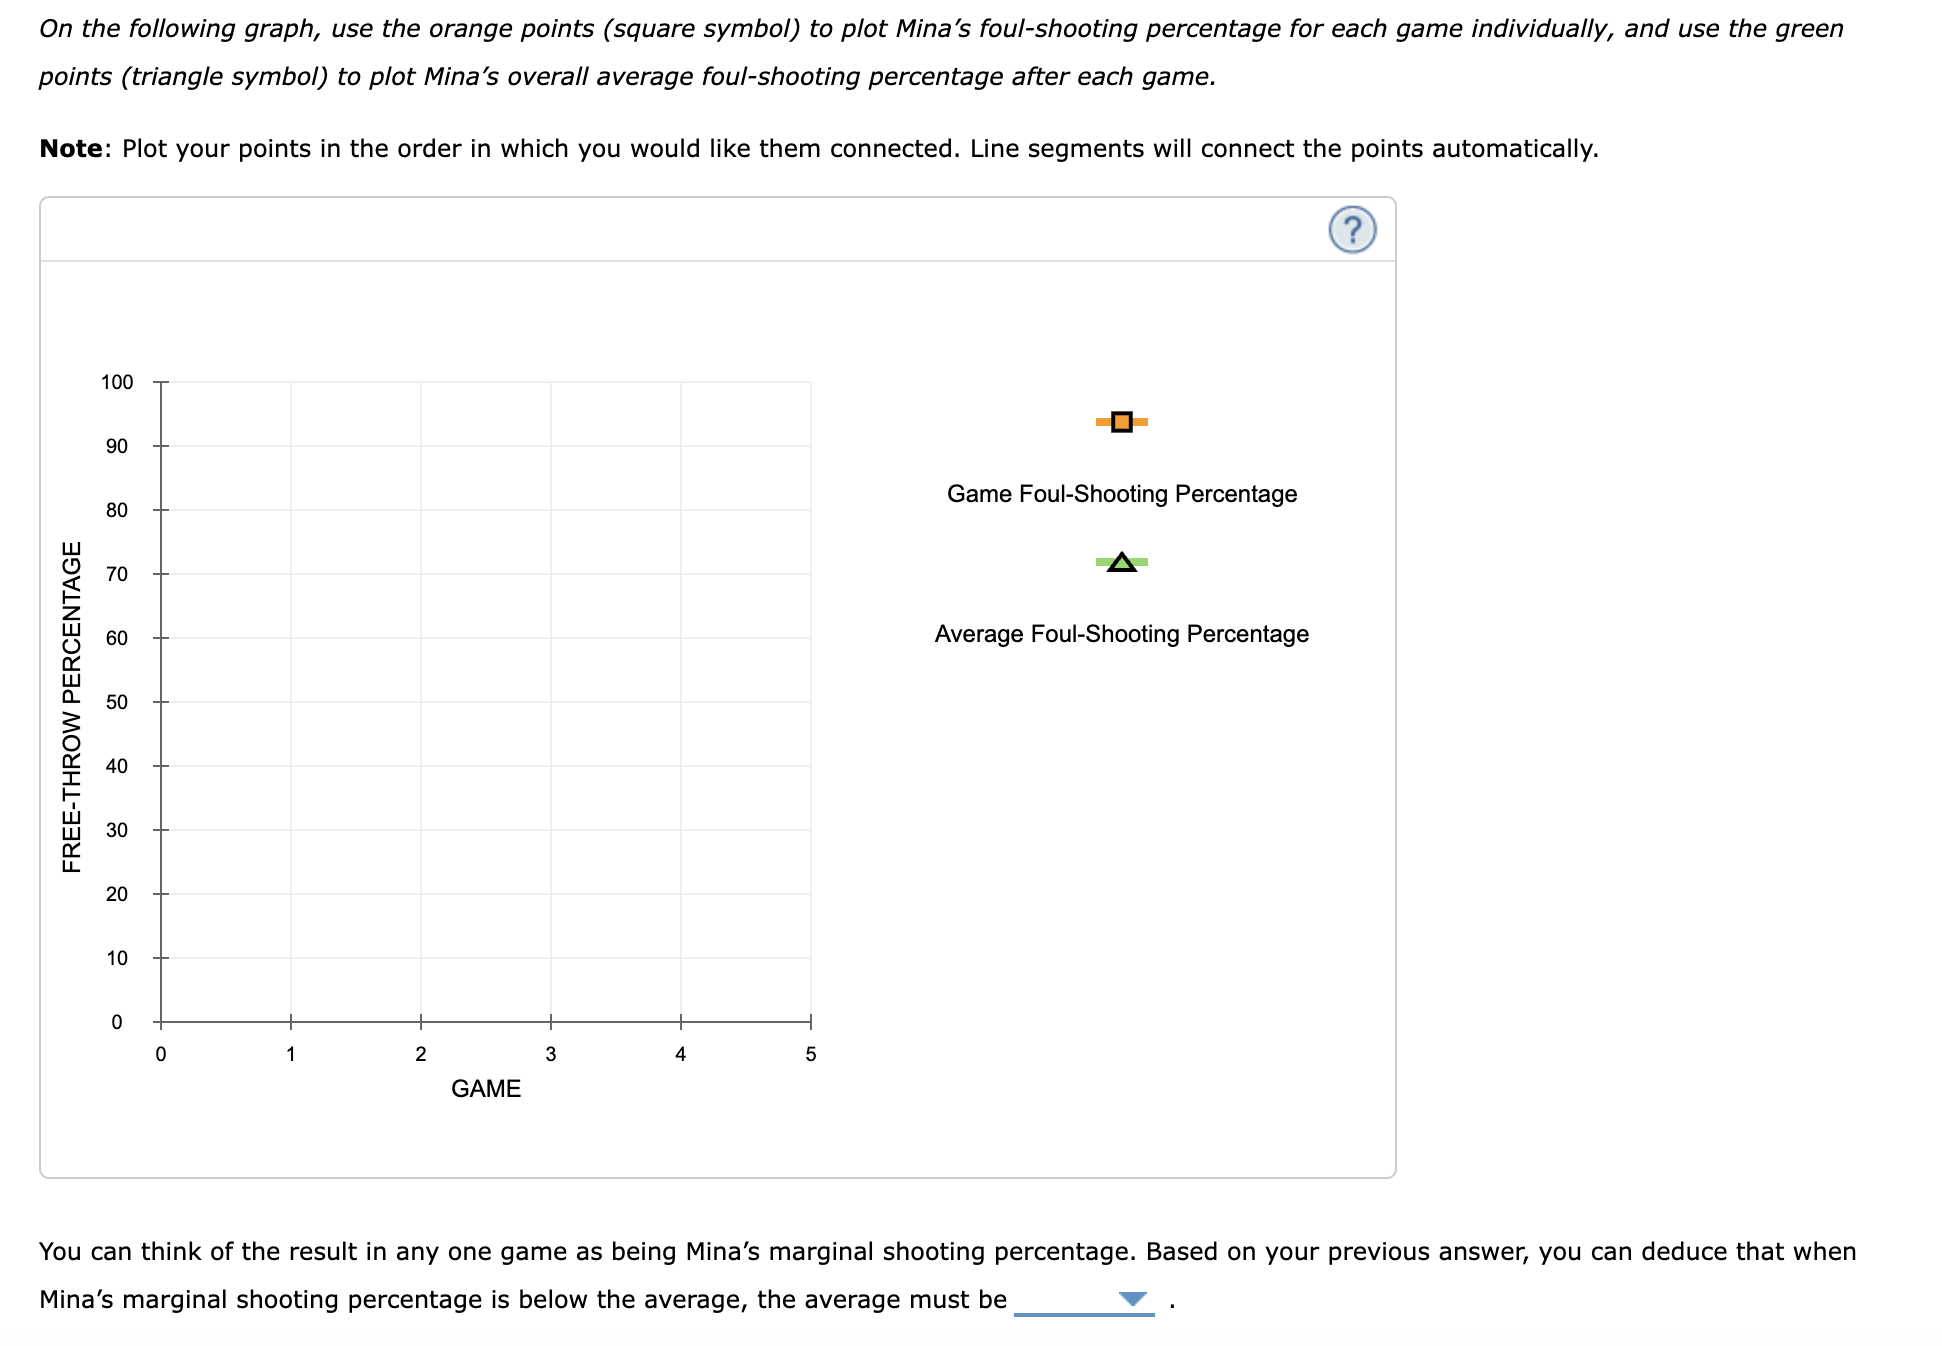
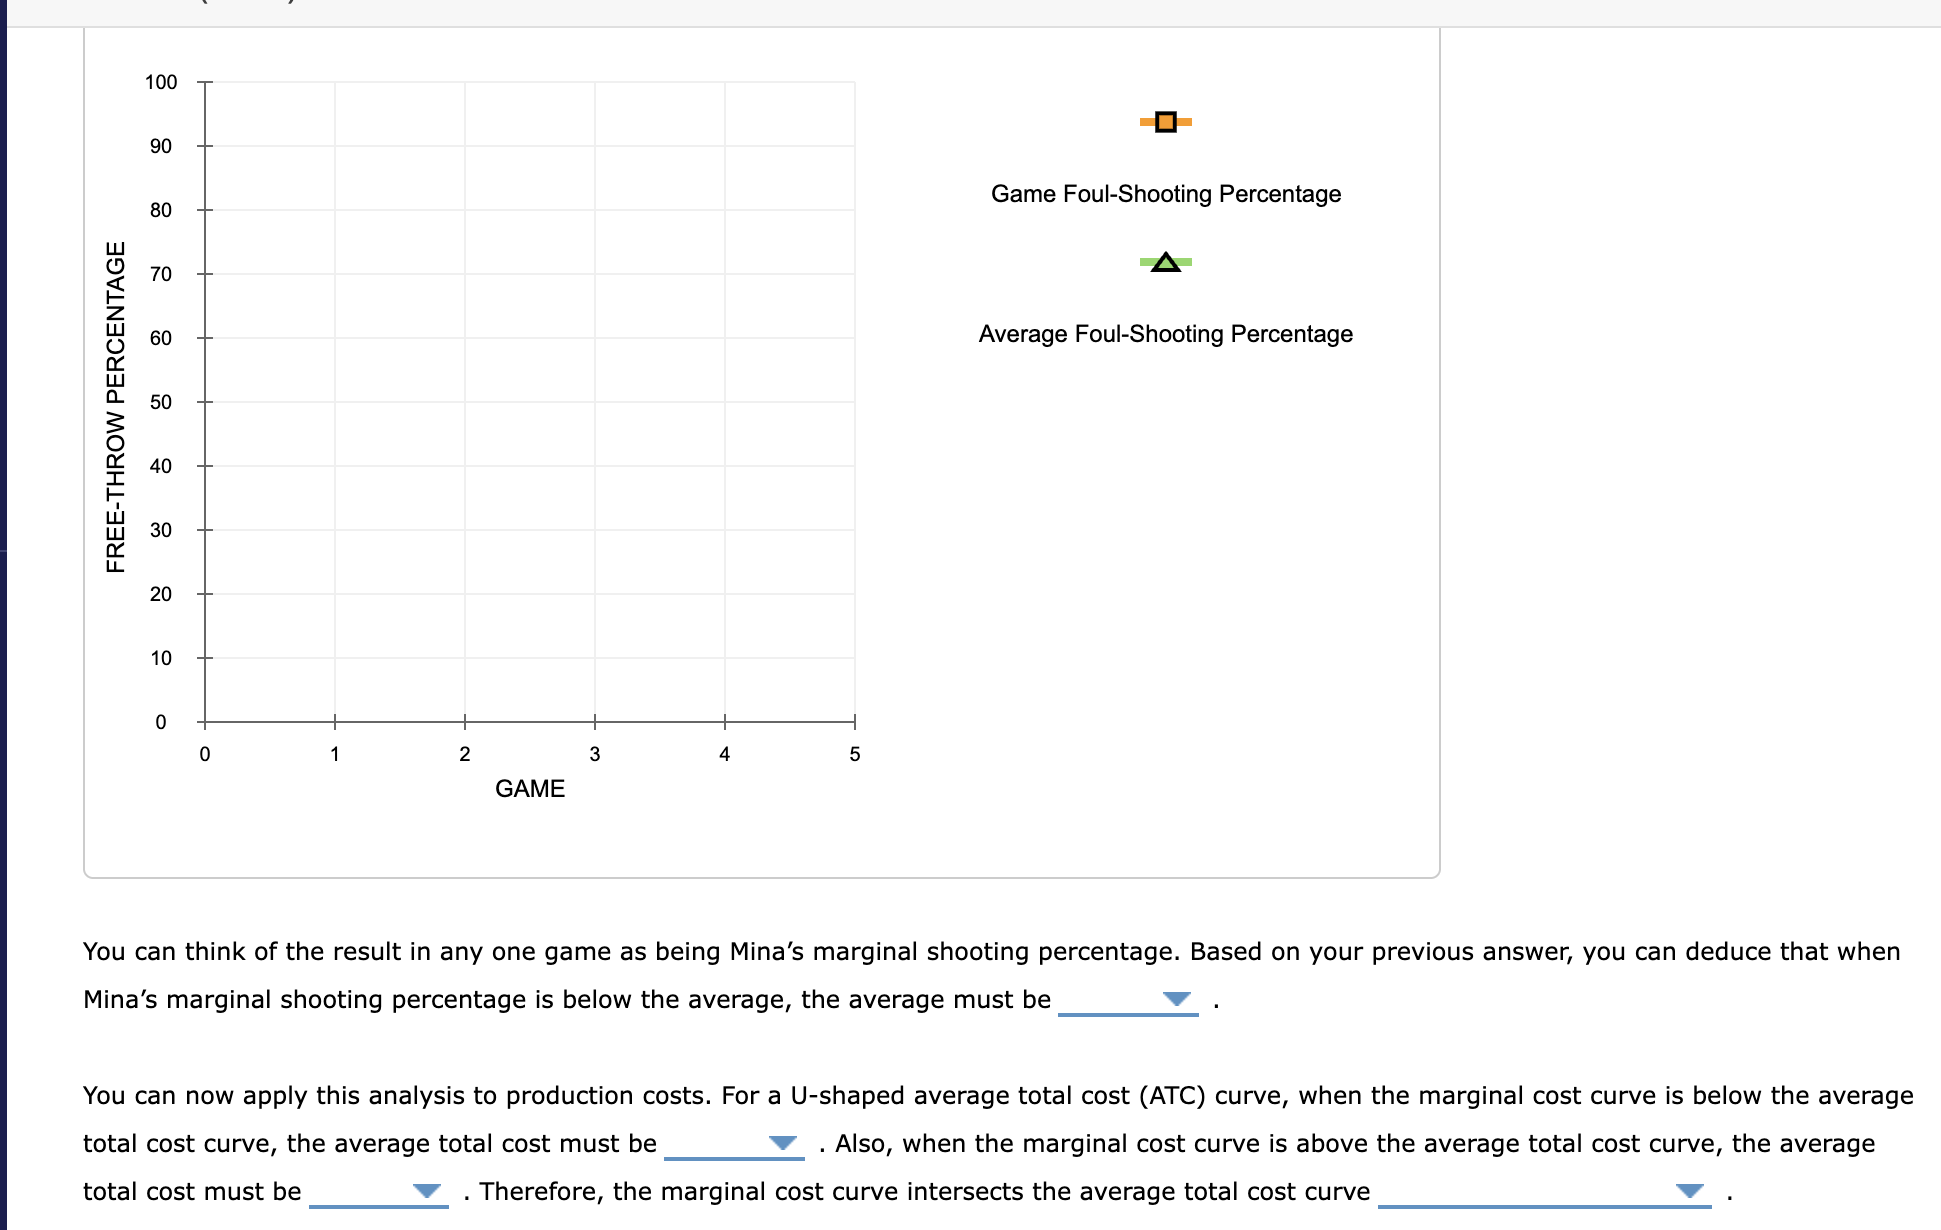
The following scenario examines the relationship between marginal and average values. Suppose Mina is a high school basketball player. The following table presents their game-by-game results for foul shots. Fill in the columns with Mina’s foul-shooting percentage for each game and their overall foul-shooting average after each game. Game Game Result Total Game Foul-Shooting Percentage Average Foul-Shooting Percentage 14/54/5808022/56/10 31/47/14 41/28/16 54/412/20 On the following graph, use the orange points (square symbol) to plot Mina’s foul-shooting percentage for each game individually, and use the green points (triangle symbol) to plot Mina’s overall average foul-shooting percentage after each game. Note: Plot your points in the order in which you would like them connected. Line segments will connect the points automatically. Game Foul-Shooting PercentageAverage Foul-Shooting Percentage0123451009080706050403020100FREE-THROW PERCENTAGEGAME You can think of the result in any one game as being Mina’s marginal shooting percentage. Based on your previous answer, you can deduce that when Mina’s marginal shooting percentage is below the average, the average must be . You can now apply this analysis to production costs. For a U-shaped average total cost (ATC) curve, when the marginal cost curve is below the average total cost curve, the average total cost must be . Also, when the marginal cost curve is above the average total cost curve, the average total cost must be . Therefore, the marginal cost curve intersects the average total cost curve . The following scenario examines the relationship between marginal and average values. Suppose Mina is a high school basketball player. The following table presents their game-by-game results for foul shots. Fill in the columns with Mina's foul-shooting percentage for each game and their overall foul-shooting average after each game. On the following graph, use the orange points (square symbol) to plot Mina's foul-shooting percentage for each game individually, and use the green points (triangle symbol) to plot Mina's overall average foul-shooting percentage after each game. Note: Plot your points in the order in which you would like them connected. Line segments will connect the points automatically. ? {:[" ? ",],[C,70]:} On the following graph, use the orange points (square symbol) to plot Mina's foul-shooting percentage for each game individually, and use the green points (triangle symbol) to plot Mina's overall average foul-shooting percentage after each game. Note: Plot your points in the order in which you would like them connected. Line segments will connect the points automatically. You can think of the result in any one game as being Mina's marginal shooting percentage. Based on your previous answer, you can deduce that when Mina's marginal shooting percentage is below the average, the average must be You can think of the result in any one game as being Mina's marginal shooting percentage.