Home /
Expert Answers /
Statistics and Probability /
the-following-table-contains-observed-frequencies-for-a-sample-of-200-row-variable-the-p-value-is-pa134
(Solved): The following table contains observed frequencies for a sample of 200. Row Variable The p-value is - ...
The following table contains observed frequencies for a sample of 200. Row Variable The p-value is - Select your answer - ? What is your conclusion? - Select your answer - P Q Test for independence of the row and column variables using a = = .05 . Compute the value of the X² test statistic (to 2 decimals). Column Variable A 25 25 B C 46 60 24 20
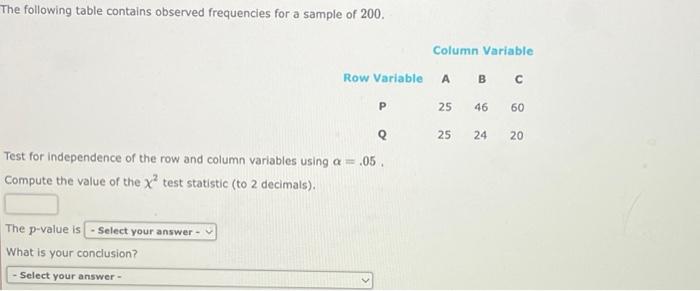
The following table contains observed frequencies for a sample of 200 . Test for independence of the row and column variables using . Compute the value of the test statistic (to 2 decimals). The -value is What is your conclusion?