Home /
Expert Answers /
Statistics and Probability /
the-frequency-distribution-was-obtained-using-a-class-width-of-0-5-for-data-on-cigarette-tax-rates-pa482
(Solved): The frequency distribution was obtained using a class width of 0.5 for data on cigarette tax rates. ...
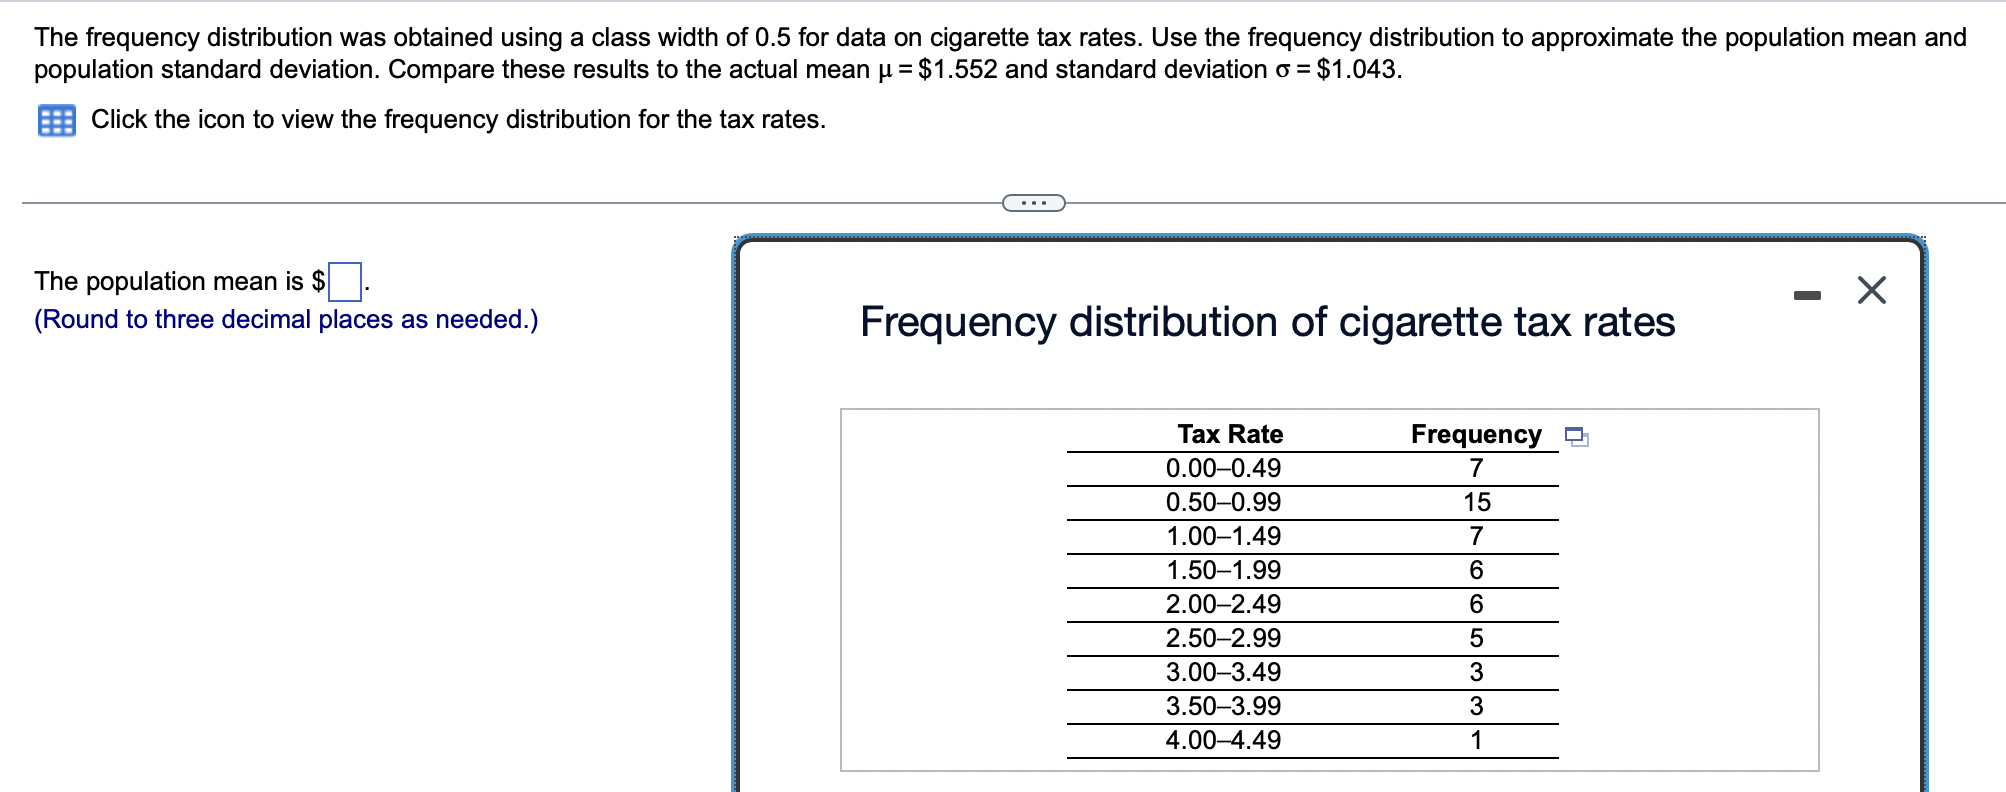
The frequency distribution was obtained using a class width of 0.5 for data on cigarette tax rates. Use the frequency distribution to approximate the population mean and population standard deviation. Compare these results to the actual mean
\mu =$1.552and standard deviation
\sigma =$1.043. Click the icon to view the frequency distribution for the tax rates. The population mean is
$(Round to three decimal places as needed.) Frequency distribution of cigarette tax rates