Home /
Expert Answers /
Economics /
the-graph-at-the-right-shows-the-market-for-tiger-shrimp-the-market-is-initially-in-equilibrium-a-pa744
(Solved): The graph at the right shows the market for tiger shrimp. The market is initially in equilibrium a ...
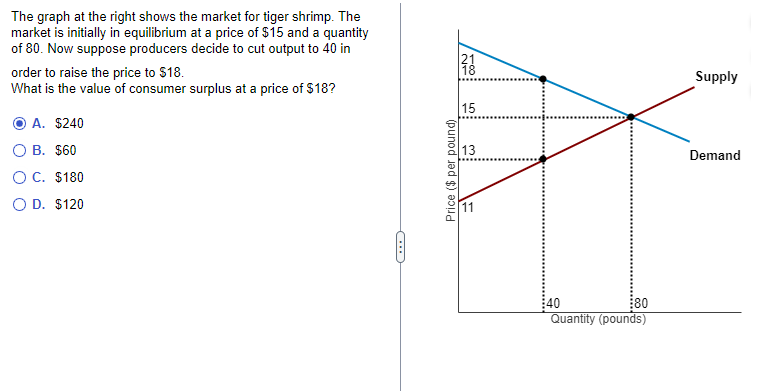
The graph at the right shows the market for tiger shrimp. The market is initially in equilibrium at a price of and a quantity of 80 . Now suppose producers decide to cut output to 40 in order to raise the price to . What is the value of consumer surplus at a price of ? A. B. C. D.
Expert Answer
Answer : Given data : equilibrium at a price of = $15