Home /
Expert Answers /
Biology /
the-graph-below-shows-how-enzymes-from-two-different-organisms-are-affected-by-increasing-temperatu-pa643
(Solved): The graph below shows how enzymes from two different organisms are affected by increasing temperatu ...
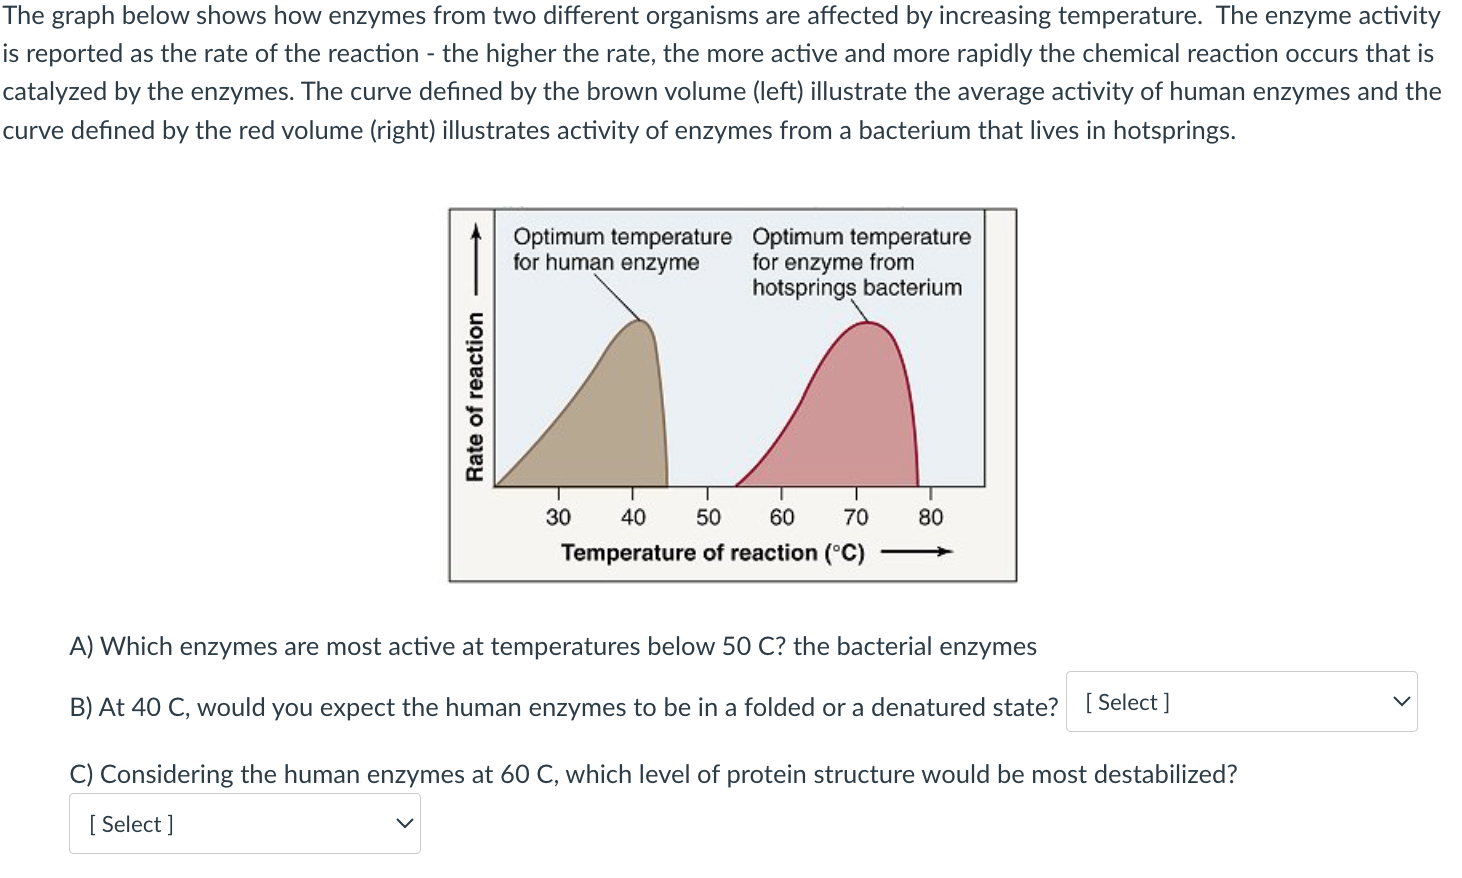
The graph below shows how enzymes from two different organisms are affected by increasing temperature. The enzyme activity is reported as the rate of the reaction - the higher the rate, the more active and more rapidly the chemical reaction occurs that is catalyzed by the enzymes. The curve defined by the brown volume (left) illustrate the average activity of human enzymes and the curve defined by the red volume (right) illustrates activity of enzymes from a bacterium that lives in hotsprings. A) Which enzymes are most active at temperatures below 50 C? the bacterial enzymes B) At , would you expect the human enzymes to be in a folded or a denatured state? C) Considering the human enzymes at , which level of protein structure would be most destabilized?
