Home /
Expert Answers /
Statistics and Probability /
the-graph-below-shows-the-amounts-of-rainfall-for-six-months-a-what-was-the-least-amount-of-rainfa-pa439
(Solved): The graph below shows the amounts of rainfall for six months.(a) What was the least amount of rainfa ...
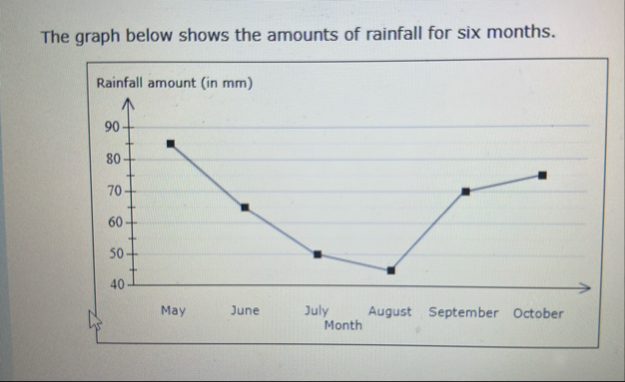
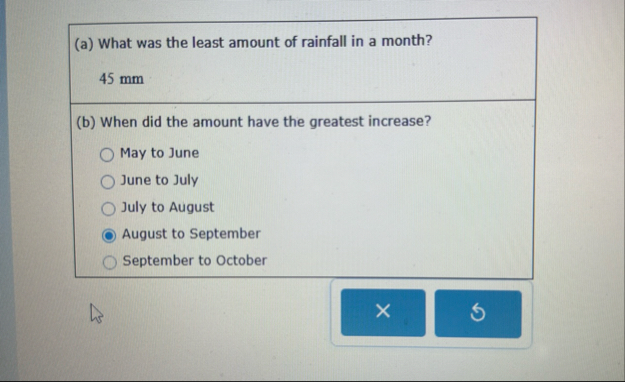
The graph below shows the amounts of rainfall for six months.(a) What was the least amount of rainfall in a month?
45mm(b) When did the amount have the greatest increase? May to June June to July July to August August to September September to October