Home /
Expert Answers /
Algebra /
the-graph-below-shows-the-percentage-of-nationalties-mathrm-a-and-mathrm-b-in-a-cer-pa809
(Solved): The graph below shows the percentage of nationalties \( \mathrm{A} \) and \( \mathrm{B} \) in a cer ...
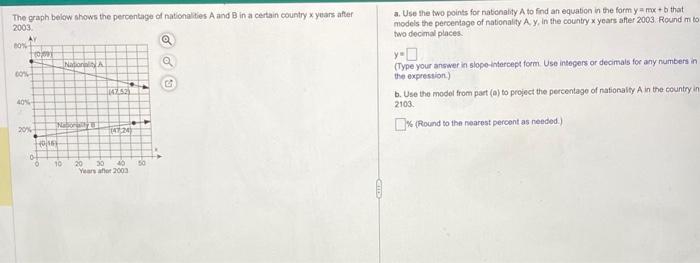
The graph below shows the percentage of nationalties \( \mathrm{A} \) and \( \mathrm{B} \) in a certain country \( \mathrm{x} \) years after a. Use the two points for nationality A to find an equation in the form \( y=r \alpha \alpha+b \) that 2003. models the percentage of nationalify A. \( y \), in the country \( x \) years after 2003 . Round \( m \) to two decmal places. \( y= \) (Type your answer in slope-intercept form Use integers or decimals for any numbers in the expression.) b. Use the model from part (a) to project the percentage of nationalty A in the country in 2103. 6 (Round to the nearest percont as needed.)
Expert Answer
a) We know that the slope of a line passing through the points (x1,y