(Solved): The graph given shows the supply (Q_(S))=(2P) and demand (Q_(D))=(12-P) for cigarettes. k^(\pi ) If ...
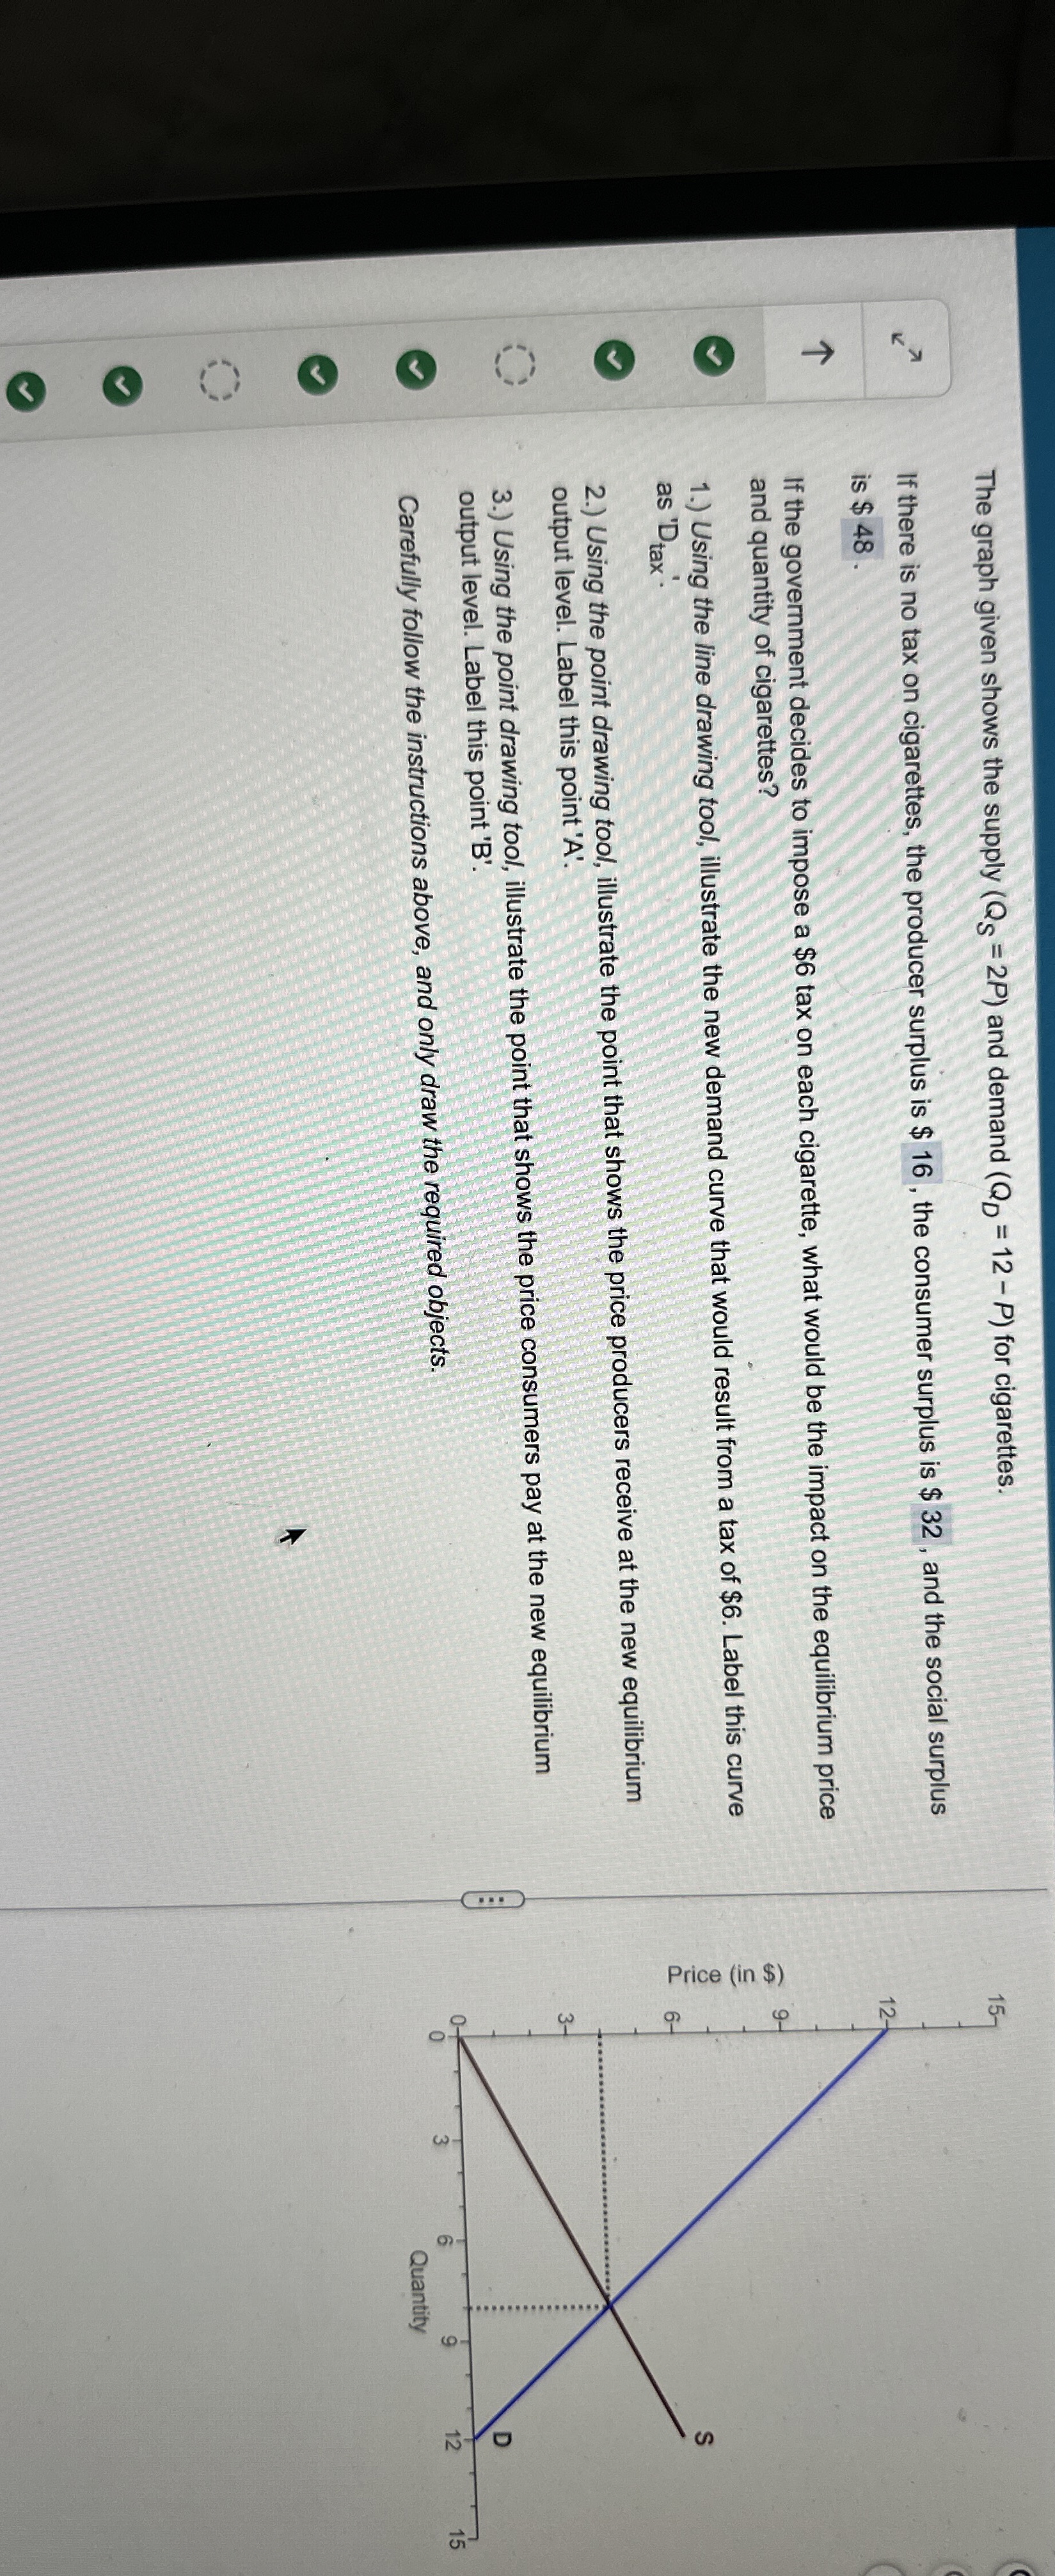
The graph given shows the supply
(Q_(S))
=(
2P)and demand
(Q_(D))
=(
12-P)for cigarettes.
k^(\pi )If there is no tax on cigarettes, the producer surplus is
$16, the consumer surplus is
$32, and the social surplus is
$48. If the government decides to impose a
$6tax on each cigarette, what would be the impact on the equilibrium price and quantity of cigarettes? 1.) Using the line drawing tool, illustrate the new demand curve that would result from a tax of
$6. Label this curve as '
D_(tax )'. 2.) Using the point drawing tool, illustrate the point that shows the price producers receive at the new equilibrium output level. Label this point '
A'. 3.) Using the point drawing tool, illustrate the point that shows the price consumers pay at the new equilibrium output level. Label this point '
B'. Carefully follow the instructions above, and only draw the required objects.