Home /
Expert Answers /
Statistics and Probability /
the-graph-illustrates-the-distribution-of-test-scores-taken-by-college-algebra-students-the-maximum-pa834
(Solved): The graph illustrates the distribution of test scores taken by College Algebra students. The maximum ...
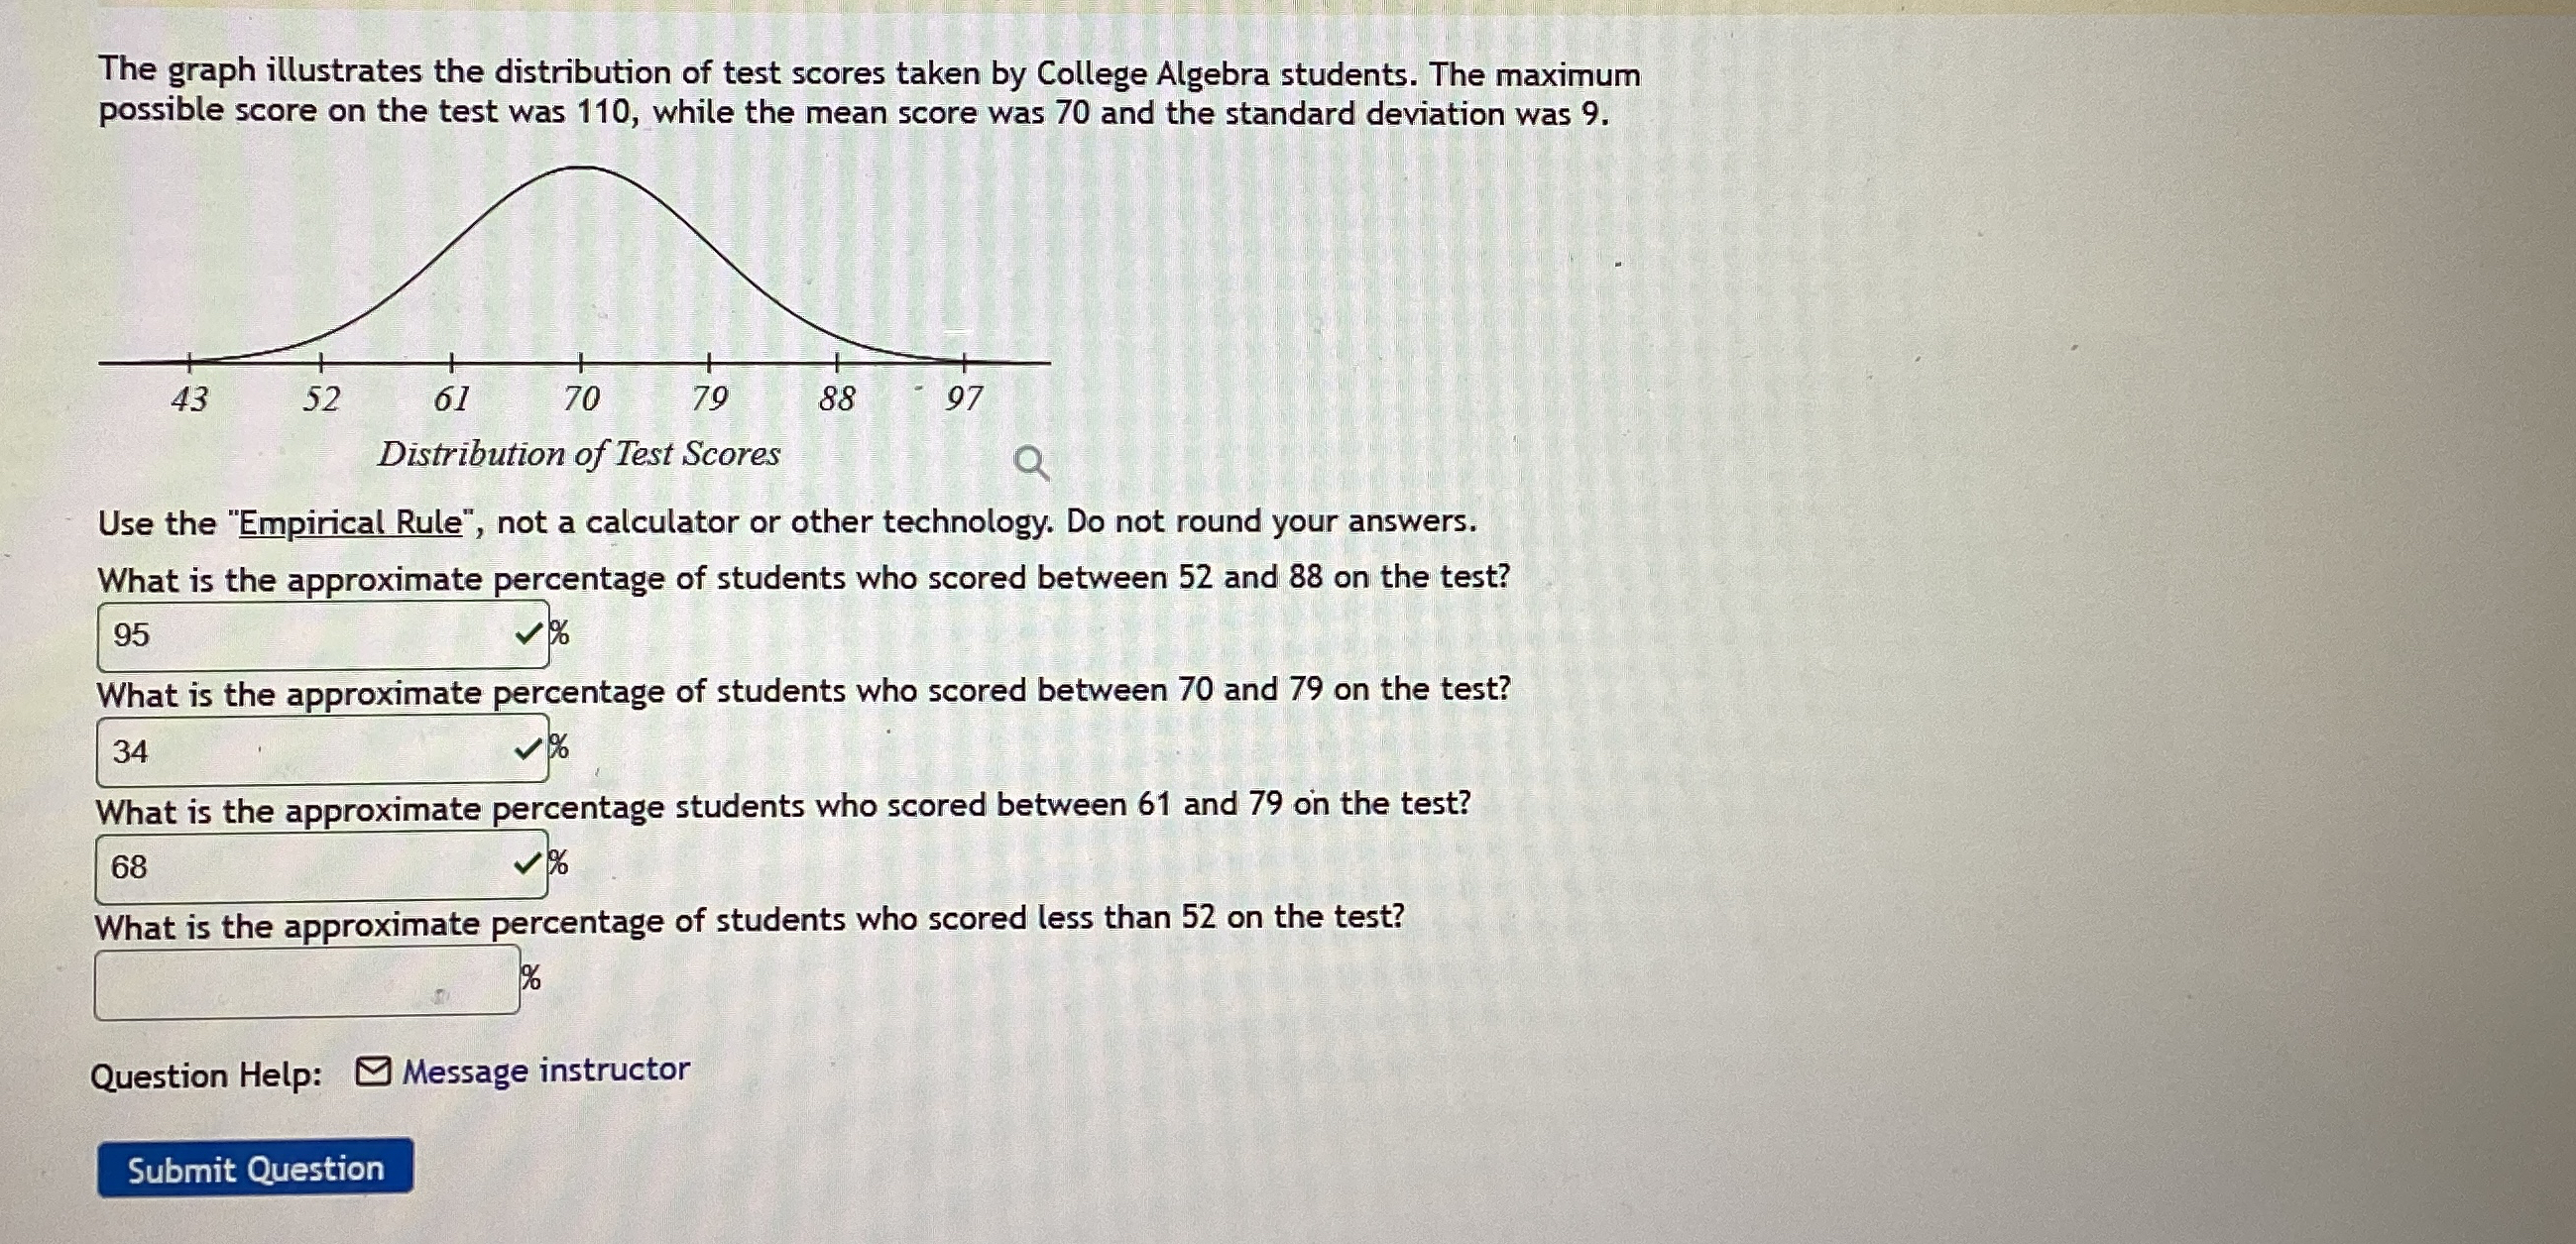
The graph illustrates the distribution of test scores taken by College Algebra students. The maximum possible score on the test was 110, while the mean score was 70 and the standard deviation was 9. Use the "Empirical Rule", not a calculator or other technology. Do not round your answers. What is the approximate percentage of students who scored between 52 and 88 on the test?
?What is the approximate percentage of students who scored between 70 and 79 on the test?
?34 % What is the approximate percentage students who scored between 61 and 79 on the test?
?68 % What is the approximate percentage of students who scored less than 52 on the test?
?Question Help: Message instructor
?