Home /
Expert Answers /
Calculus /
the-graph-of-the-function-has-one-relative-maximum-and-one-relative-minimum-point-plot-these-two-pa218
(Solved): The graph of the function has one relative maximum and one relative minimum point. Plot these two ...
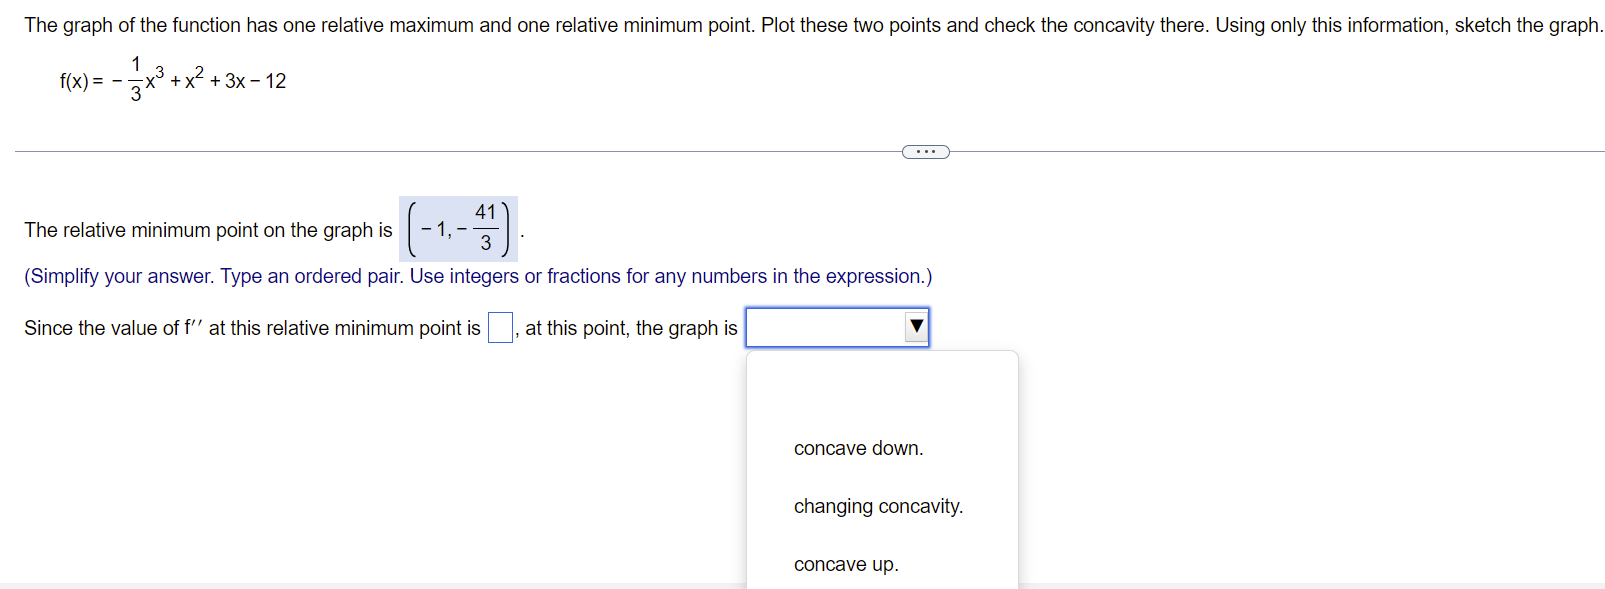
The graph of the function has one relative maximum and one relative minimum point. Plot these two points and check the concavity there. Using only this information, sketch the graph. 1 f(x) = 3 x3 +x² + 3x - 12 The relative minimum point on the graph is -1.- 41 3 (Simplify your answer. Type an ordered pair. Use integers or fractions for any numbers in the expression.) Since the value of f'' at this relative minimum point is, at this point, the graph is concave down. changing concavity. concave up.