Home /
Expert Answers /
Calculus /
the-graph-of-y-f-x-x2-is-shown-below-dashed-curve-manipulate-the-green-draggable-points-to-obta-pa690
(Solved): The graph of y=f(x)=x2 is shown below (dashed curve). Manipulate the green draggable points to obta ...
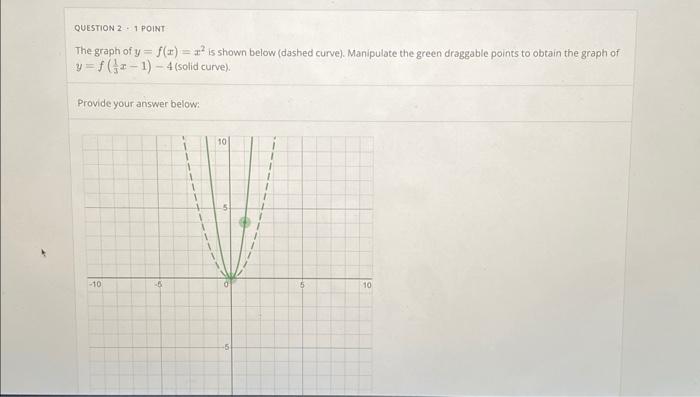
The graph of y=f(x)=x2 is shown below (dashed curve). Manipulate the green draggable points to obtain the graph of y=f(31?x?1)?4 (solid curve). Provide your answer below: