Home /
Expert Answers /
Chemistry /
the-graph-shown-is-a-boiling-point-composition-curve-for-a-mixture-of-cyclohexane-and-toluene-the-lo-pa358
(Solved): The graph shown is a boiling point-composition curve for a mixture of cyclohexane and toluene The lo ...
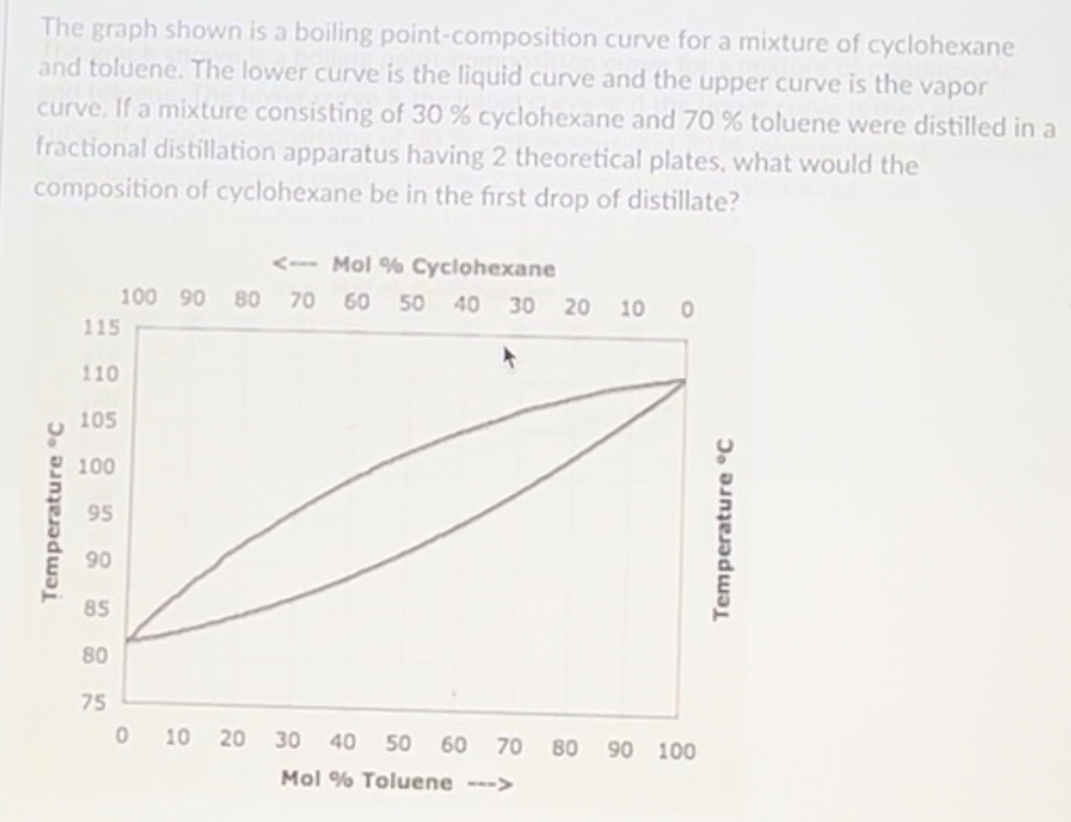
The graph shown is a boiling point-composition curve for a mixture of cyclohexane and toluene The lower curve is the liquid curve and the upper curve is the vapor curve, If a mixture consisting of
30%cyclohexane and
70%toluene were distilled in a fractional distillation apparatus having 2 theoretical plates, what would the composition of cyclohexane be in the first drop of distillate?