Home /
Expert Answers /
Economics /
the-graph-shows-an-economy-39-s-aggregate-demand-curve-short-run-aggregate-supply-curve-long-run-agg-pa628
(Solved): The graph shows an economy's aggregate demand curve, short-run aggregate supply curve, long-run aggr ...
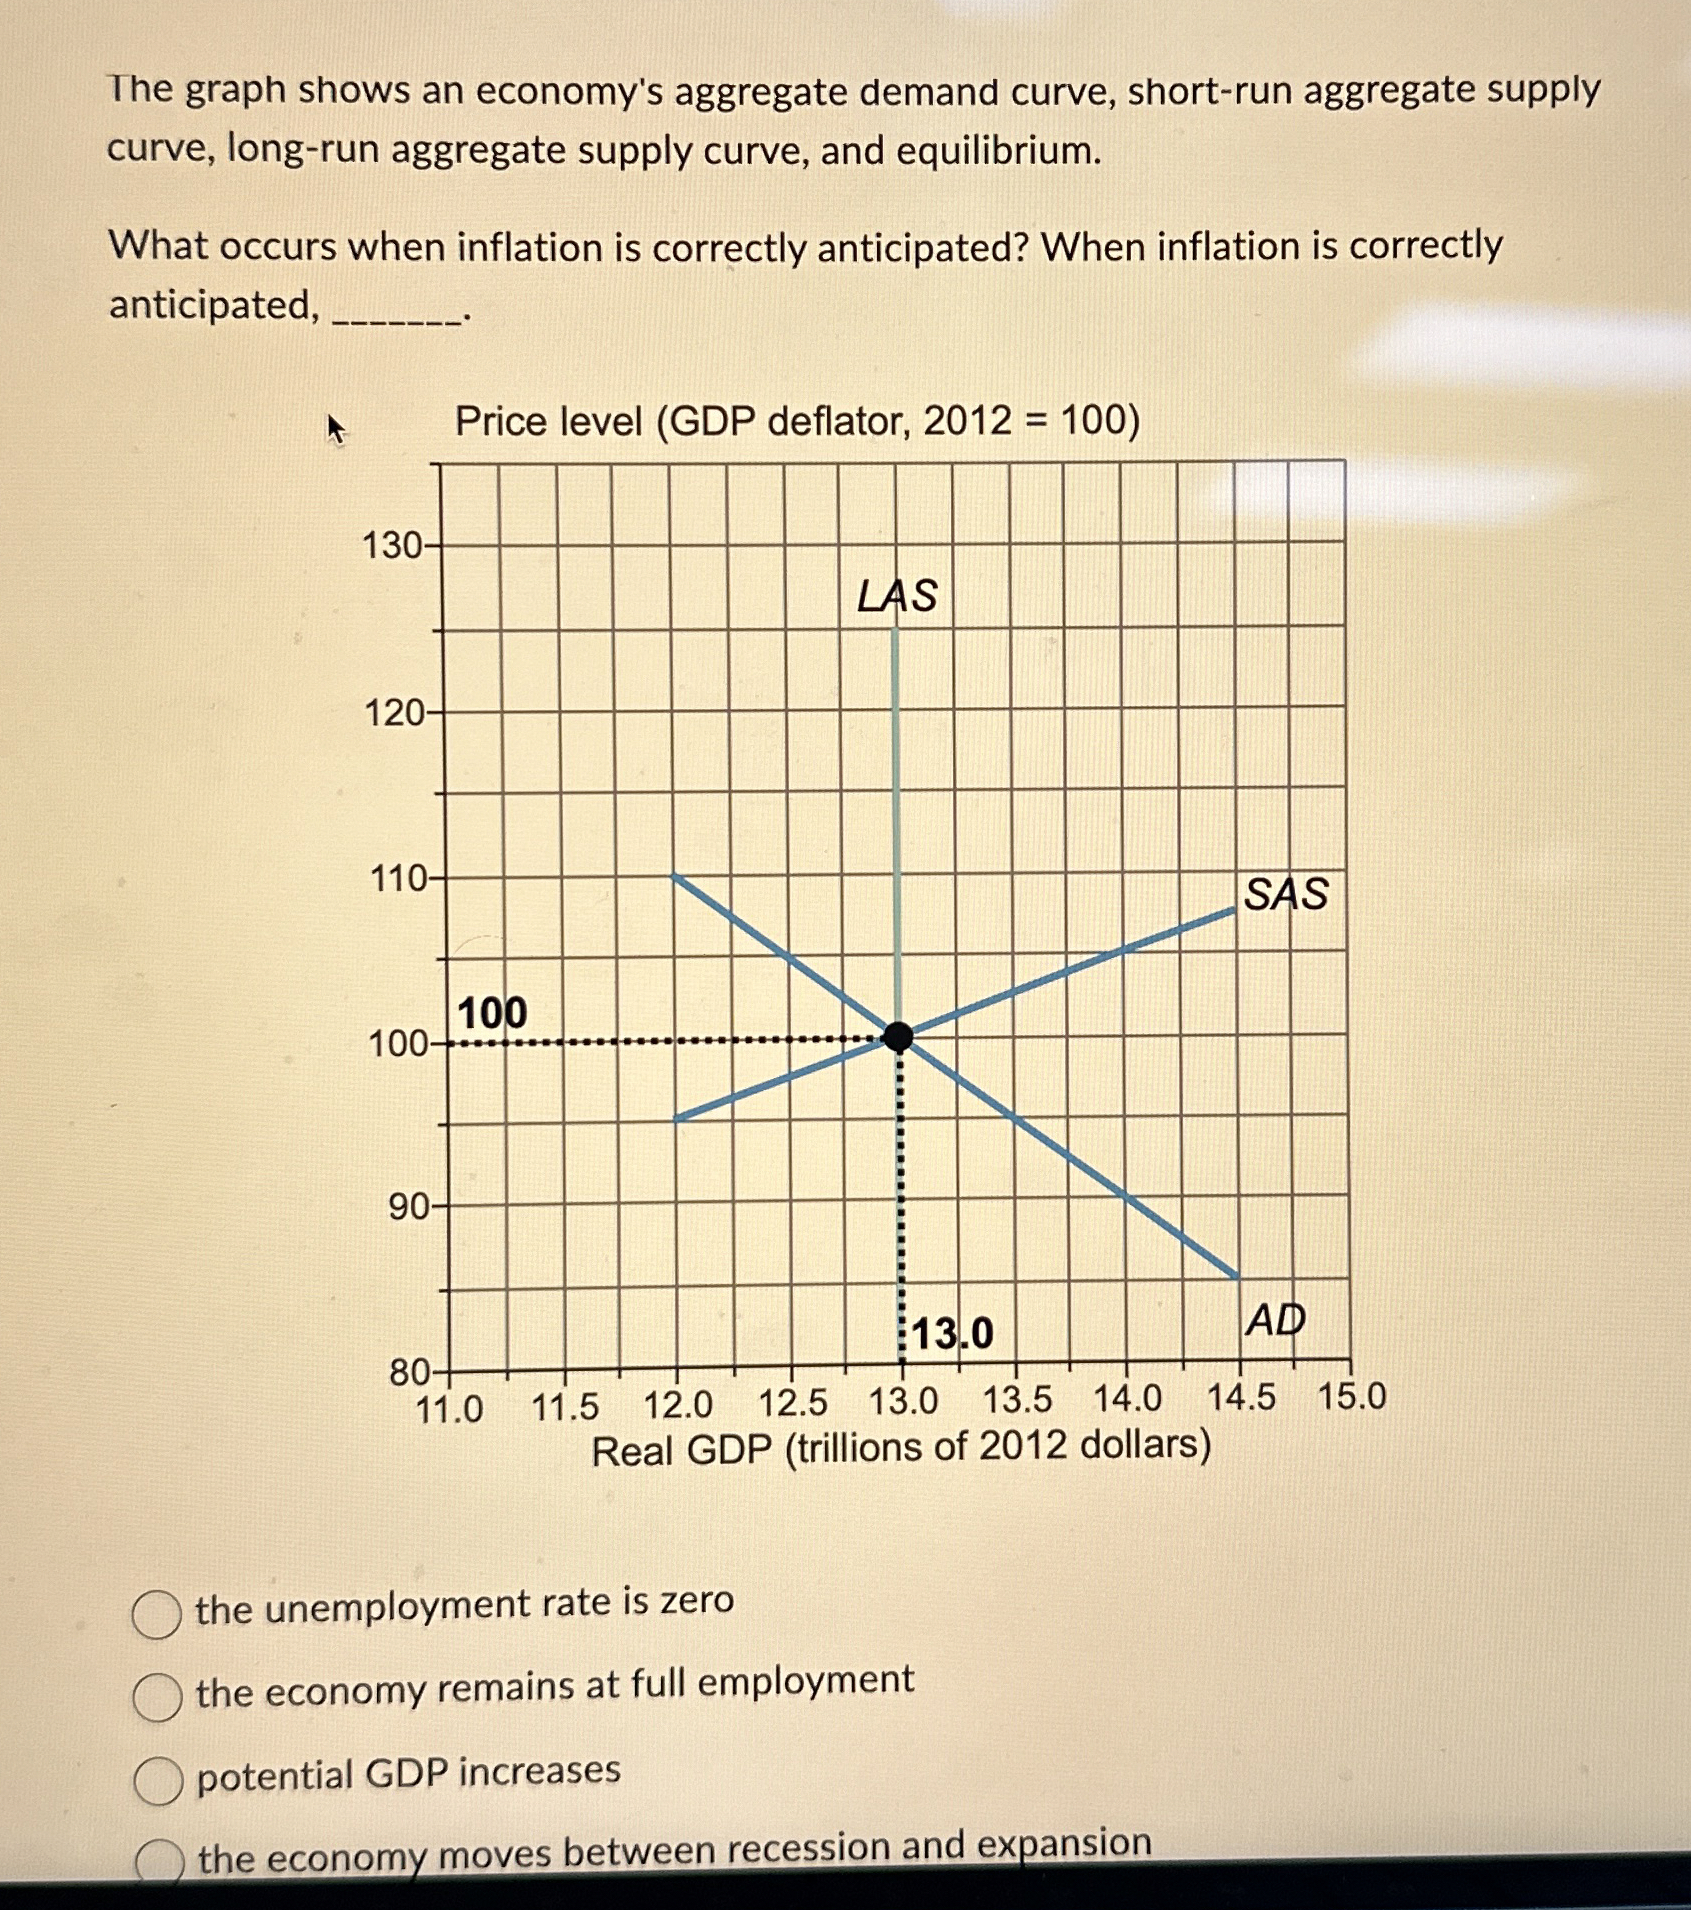
The graph shows an economy's aggregate demand curve, short-run aggregate supply curve, long-run aggregate supply curve, and equilibrium. What occurs when inflation is correctly anticipated? When inflation is correctly anticipated, Price level (GDP deflator,
2012=100) the unemployment rate is zero the economy remains at full employment potential GDP increases the economy moves between recession and expansion