Home /
Expert Answers /
Economics /
the-graph-shows-an-economy-39-s-labor-market-in-the-graph-draw-a-point-at-the-labor-market-equilibr-pa746
(Solved): The graph shows an economy's labor market. In the graph, draw a point at the labor market equilibr ...
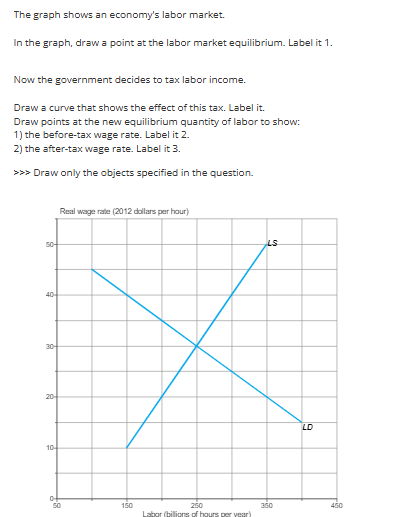
The graph shows an economy's labor market. In the graph, draw a point at the labor market equilibrium. Label it 1. Now the government decides to tax labor income. Draw a curve that shows the effect of this tax. Label it. Draw points at the new equilibrium quantity of labor to show: 1) the before-tax wage rate. Label it 2 . 2) the after-tax wage rate. Label it 3 . >>> Draw only the objects specified in the question.