Home /
Expert Answers /
Advanced Math /
the-graph-shows-the-displacement-from-equilibrium-of-a-mass-spring-system-as-a-function-of-time-afte-pa917
(Solved): The graph shows the displacement from equilibrium of a mass-spring system as a function of time afte ...
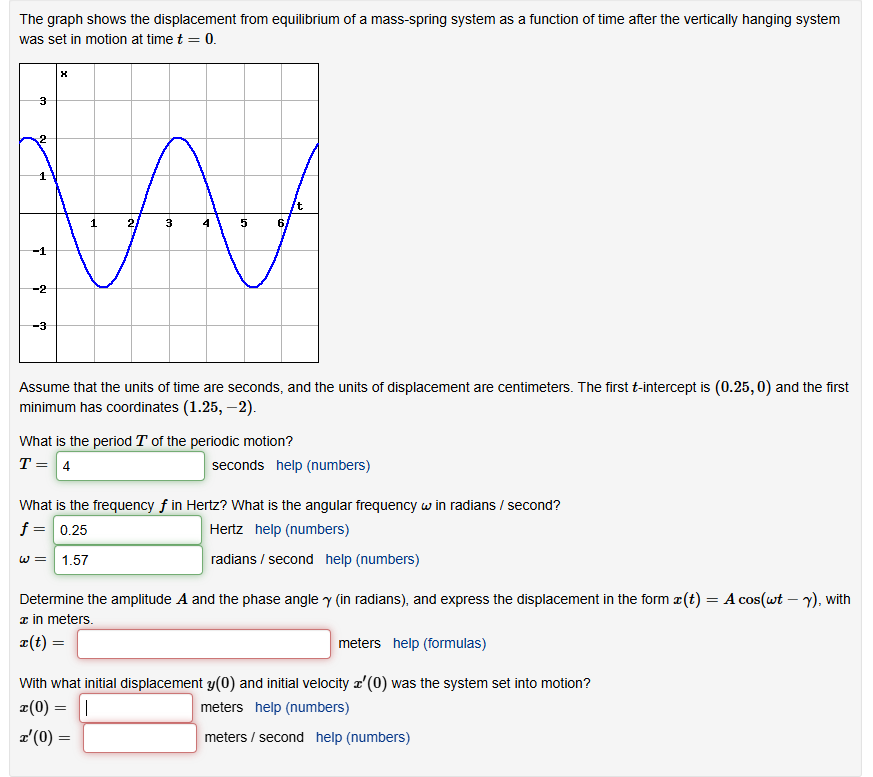
The graph shows the displacement from equilibrium of a mass-spring system as a function of time after the vertically hanging system
was set in motion at time t=0.
Assume that the units of time are seconds, and the units of displacement are centimeters. The first t-intercept is (0.25,0) and the first
minimum has coordinates (1.25,-2).
What is the period T of the periodic motion?
T=, seconds help (numbers)
What is the frequency f in Hertz? What is the angular frequency \omega in radians ()/() second?
f= Hertz help (numbers)
\omega = radians ()/() second help (numbers)
Determine the amplitude A and the phase angle \gamma (in radians), and express the displacement in the form x(t)=Acos(\omega t-\gamma ), with
x in meters.
x(t)=?, meters help (formulas)
With what initial displacement y(0) and initial velocity x^(')(0) was the system set into motion?
x(0)= meters help (numbers)
x^(')(0)= meters ()/() second help (numbers)