Home /
Expert Answers /
Economics /
the-graph-shows-the-production-function-of-an-economy-currently-the-full-employment-quantity-of-l-pa844
(Solved): The graph shows the production function of an economy. Currently, the full-employment quantity of l ...
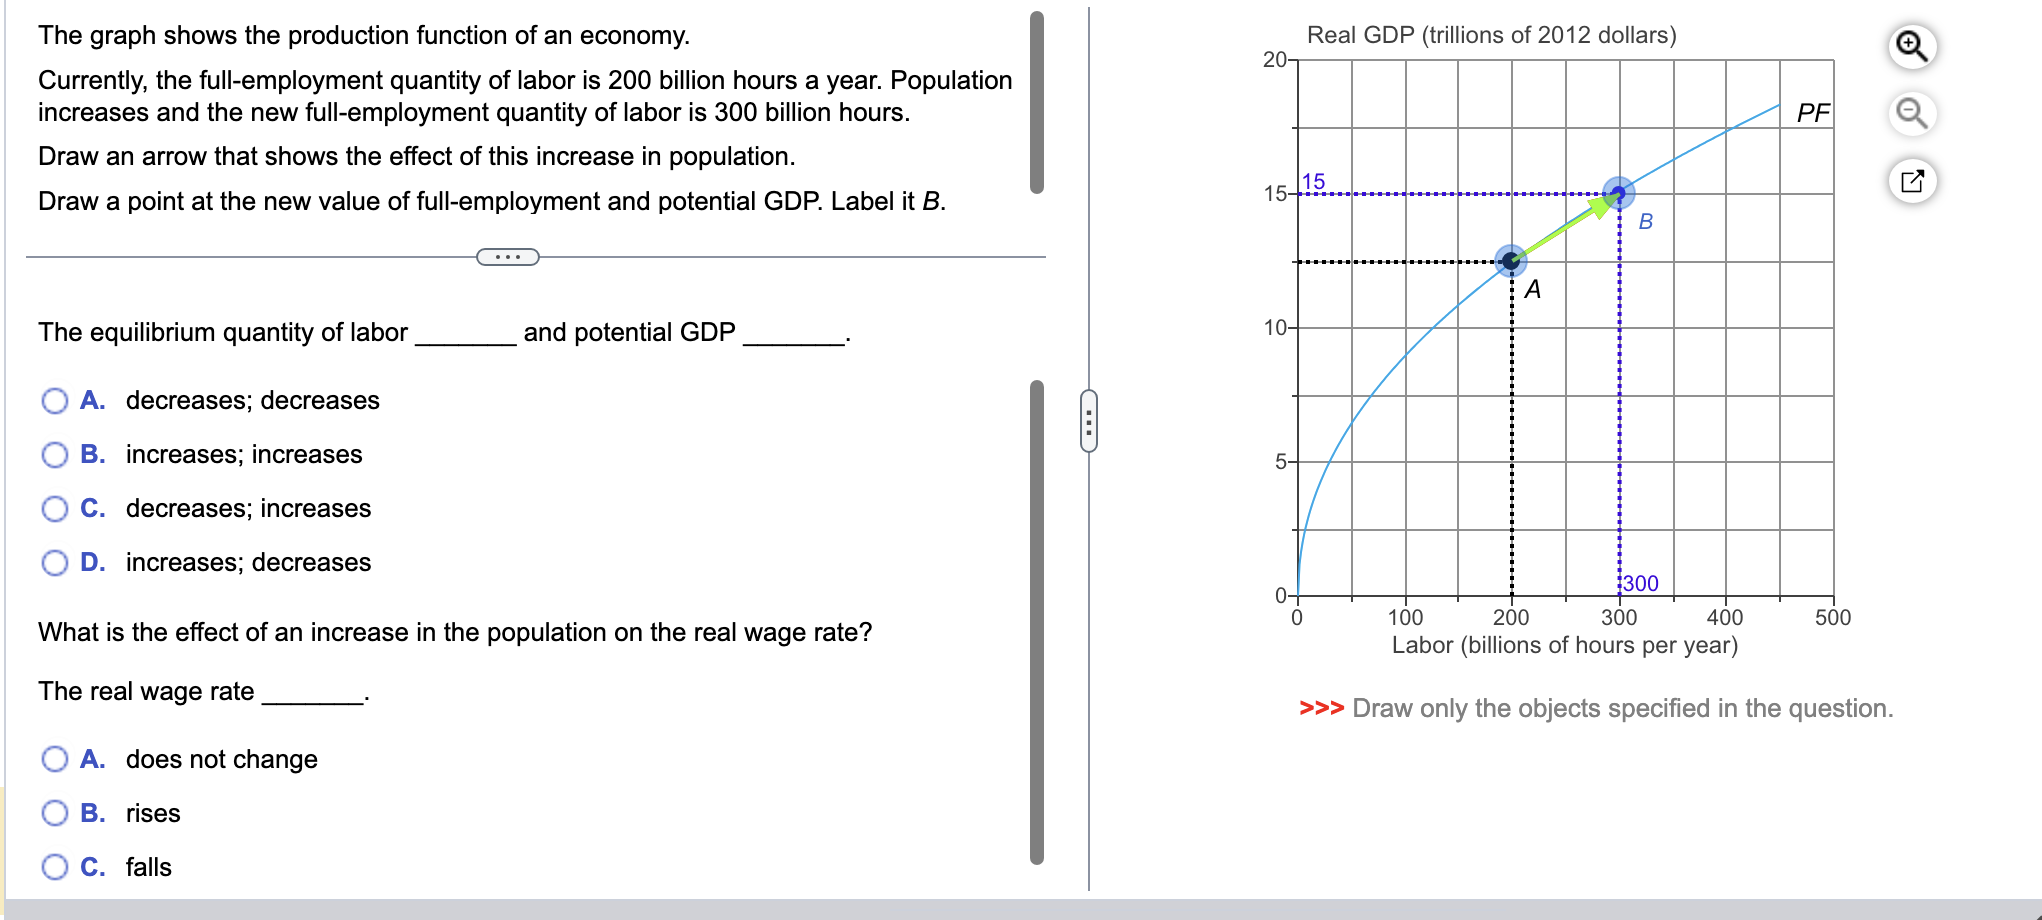
The graph shows the production function of an economy. Currently, the full-employment quantity of labor is 200 billion hours a year. Population increases and the new full-employment quantity of labor is 300 billion hours. Draw an arrow that shows the effect of this increase in population. Draw a point at the new value of full-employment and potential GDP. Label it . The equilibrium quantity of labor A. decreases; decreases B. increases; increases C. decreases; increases D. increases; decreases and potential GDP What is the effect of an increase in the population on the real wage rate? The real wage rate A. does not change B. rises C. falls ?> Draw only the objects specified in the question.