Home /
Expert Answers /
Statistics and Probability /
the-histogram-and-cumulative-percentage-polygon-below-visualize-the-property-taxes-per-capita-for-pa455
(Solved): The histogram and cumulative percentage polygon below visualize the property taxes per capita for ...
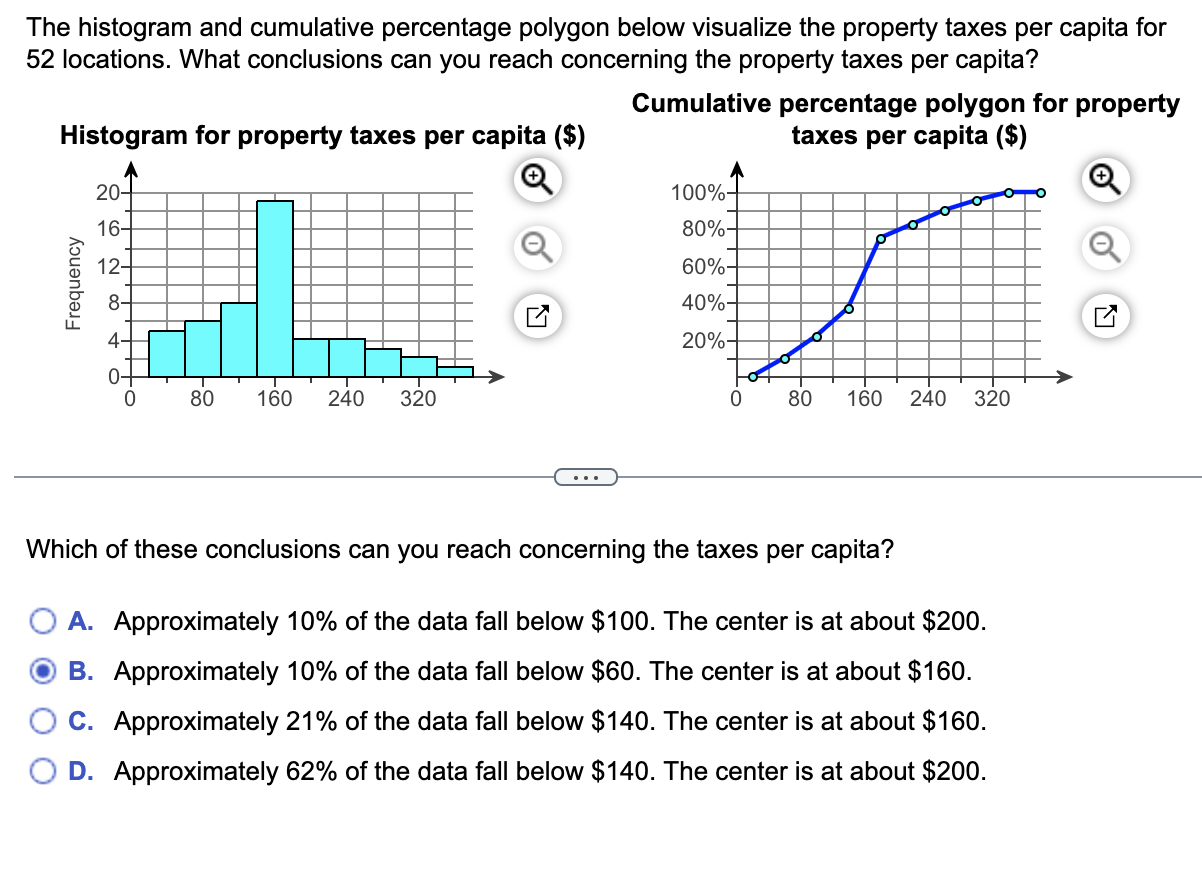
The histogram and cumulative percentage polygon below visualize the property taxes per capita for 52 locations. What conclusions can you reach concerning the property taxes per capita? Cumulative percentage polygon for property Histogram for property taxes per capita (\$) taxes per capita (\$) Which of these conclusions can you reach concerning the taxes per capita? A. Approximately \( 10 \% \) of the data fall below \( \$ 100 \). The center is at about \( \$ 200 \). B. Approximately \( 10 \% \) of the data fall below \( \$ 60 \). The center is at about \( \$ 160 \). C. Approximately \( 21 \% \) of the data fall below \( \$ 140 \). The center is at about \( \$ 160 \). D. Approximately \( 62 \% \) of the data fall below \( \$ 140 \). The center is at about \( \$ 200 \).