Home /
Expert Answers /
Mechanical Engineering /
the-landing-paths-of-three-drones-drone-a-drone-b-and-drone-c-are-modelled-by-the-curves-in-the-g-pa264
(Solved): The landing paths of three drones (drone A, drone B and drone C) are modelled by the curves in the g ...
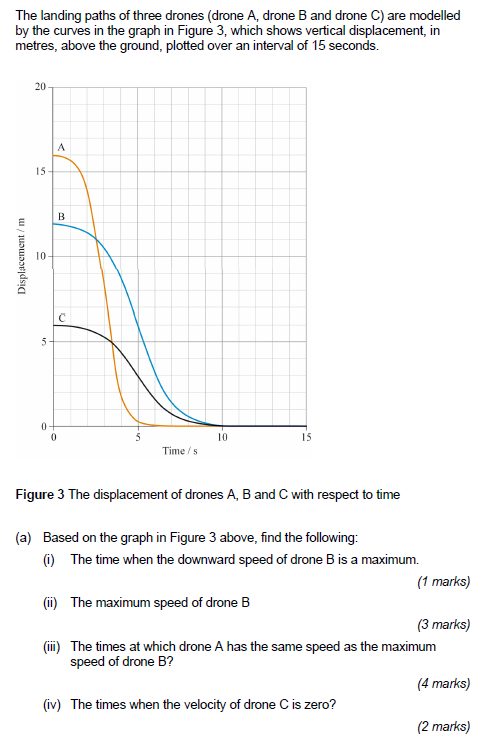
The landing paths of three drones (drone A, drone B and drone C) are modelled by the curves in the graph in Figure 3, which shows vertical displacement, in metres, above the ground, plotted over an interval of 15 seconds. Figure 3 The displacement of drones A,B and C with respect to time (a) Based on the graph in Figure 3 above, find the following: (i) The time when the downward speed of drone B is a maximum. (ii) The maximum speed of drone B (iii) The times at which drone A has the same speed as the maximum speed of drone B? (iv) The times when the velocity of drone C is zero?